
Usage Query
On the VOD console, you can view the traffic and peak bandwidth statistics of CDN, as well as the consumption of storage space and transcoding duration of the VOD origin server. There is a delay of about one hour in usage statistics.
Procedure
- Log in to the VOD console.
- In the navigation pane, choose Querying the usage.
- Select Distribution traffic, Peak Distribution Bandwidth, Media Asset Management, Data retrieval, or Transcode to view the statistics.
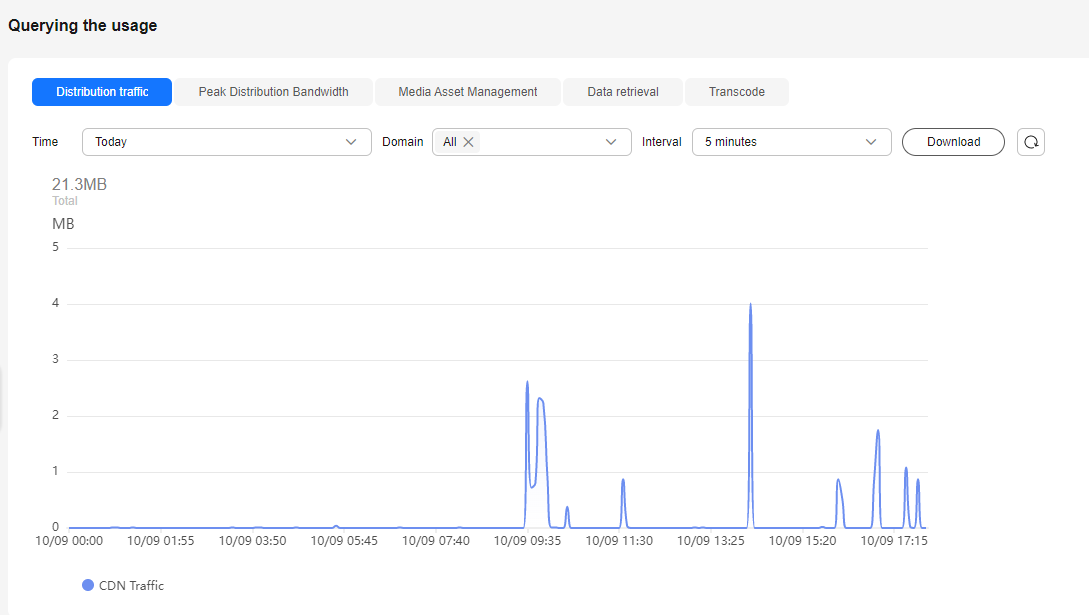
Distribution Traffic
Select the time range, domain name, and time granularity to view CDN traffic statistics.
You can click Download to export the CDN traffic statistics to the local PC.

- You can query data of the past 90 days.
- The maximum time span of a query is 31 days.
- You can query data of up to 20 domain names at a time.
- The minimum statistical granularity is five minutes. For example, data generated from November 6, 2020 08:00:00 (GMT+08:00) to November 6, 2020 08:04:59 (GMT+08:00) is displayed at the statistical point November 6, 2020 08:00:00 (GMT+08:00). The displayed data is the maximum value of the selected statistical granularity.
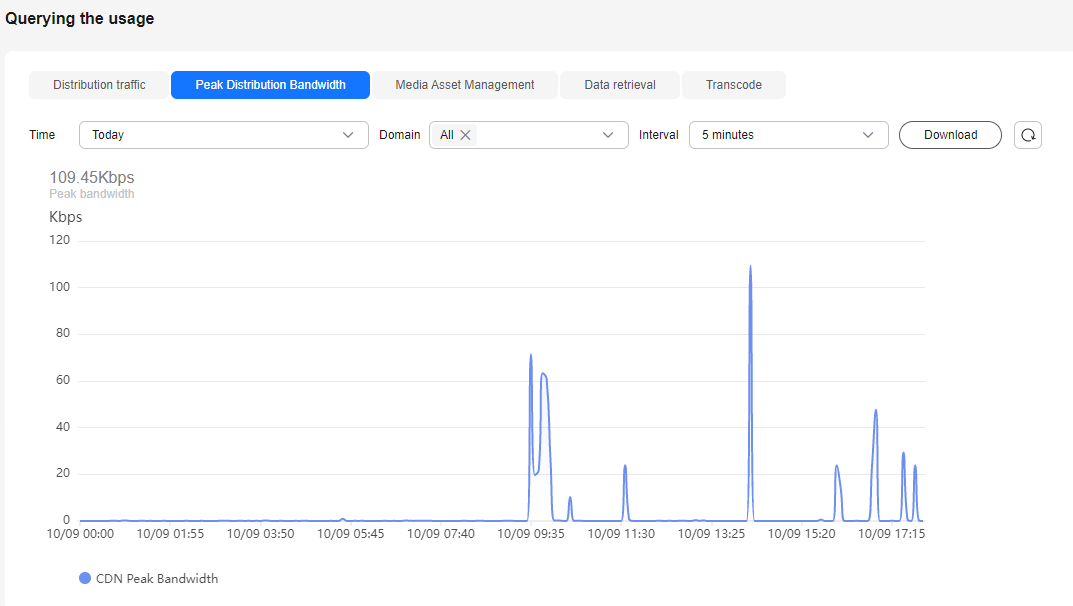
Peak Distribution Bandwidth
Select the time range, domain name, and time granularity to view CDN peak bandwidth statistics.
You can click Download to export the CDN peak bandwidth statistics to the local PC.
- You can query data of the past 90 days.
- The maximum time span of a query is 31 days.
- You can query data of up to 20 domain names at a time.
- The minimum statistical granularity is five minutes. For example, data generated from November 6, 2020 08:00:00 (GMT+08:00) to November 6, 2020 08:04:59 (GMT+08:00) is displayed at the statistical point November 6, 2020 08:00:00 (GMT+08:00). The displayed data is the maximum value of the selected statistical granularity.
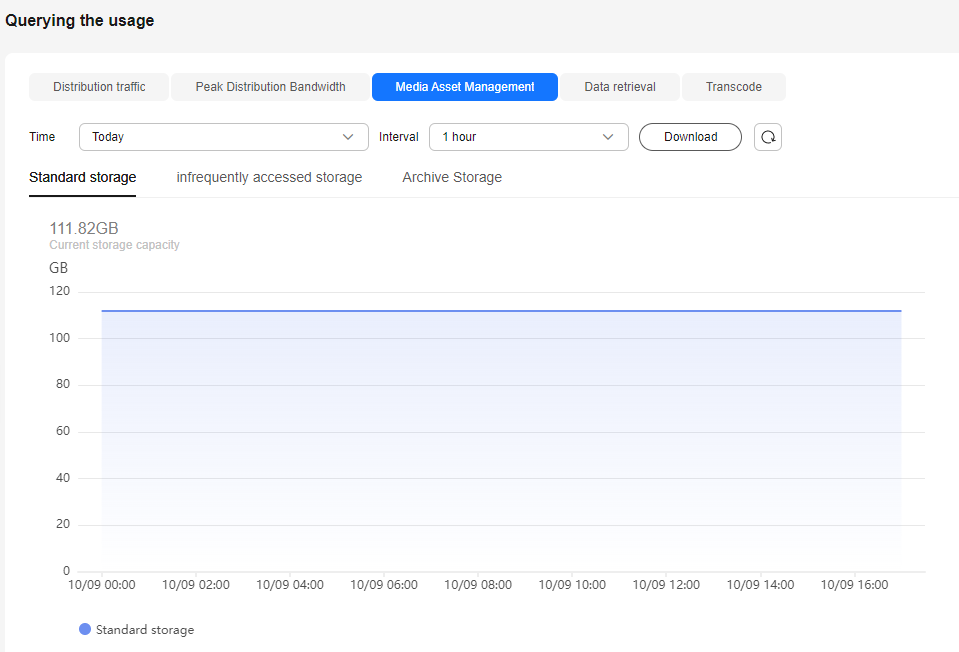
Media Asset Management
Select the time range and time granularity to view the statistics of standard storage, infrequent access storage, and archive storage of media assets.
You can click Download to export the media asset storage statistics to the local PC.
- You can query data of the past 30 days.
- The minimum statistical granularity is one hour. For example, data generated from November 6, 2020 08:00:00 (GMT+08:00) to November 6, 2020 09:00:00 (GMT+08:00) is displayed at the statistical point November 6, 2020 08:00:00 (GMT+08:00). The displayed data is the maximum value of the selected statistical granularity.
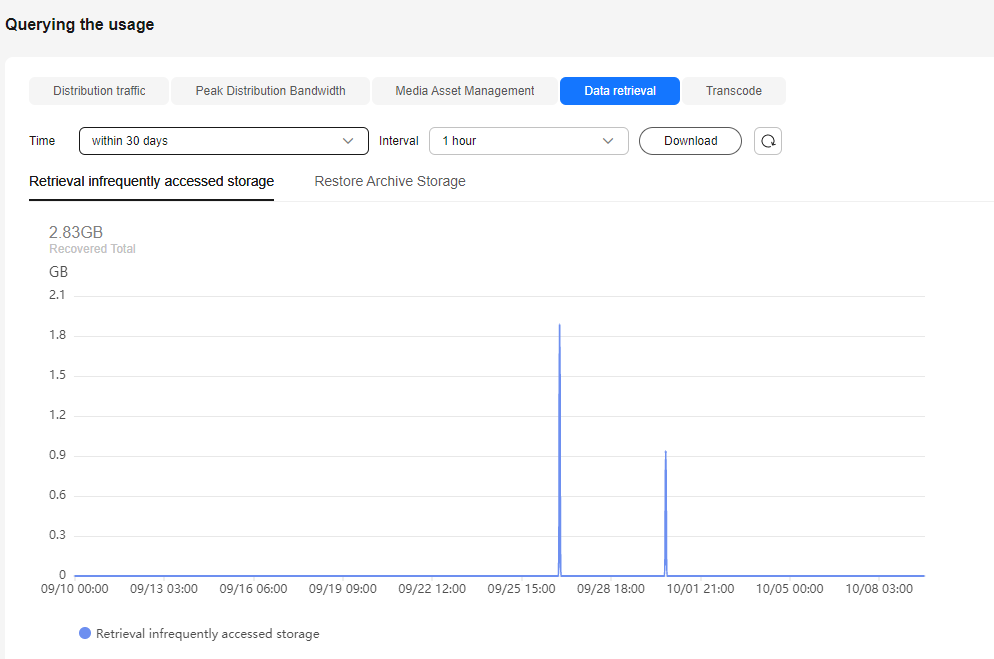
Data Retrieval
Select the time range and time granularity to view the statistics of retrieving media assets of infrequent access storage and archive storage.
You can click Download to export the media asset retrieval statistics to the local PC.
- You can query data of the past 30 days.
- The minimum statistical granularity is one hour. For example, data generated from November 6, 2020 08:00:00 (GMT+08:00) to November 6, 2020 09:00:00 (GMT+08:00) is displayed at the statistical point November 6, 2020 08:00:00 (GMT+08:00). The displayed data is the maximum value of the selected statistical granularity.
The statistical chart displays the statistics of the media asset whose storage class changes from infrequent access to standard in the selected time range. You can point to the trend chart and scroll the mouse wheel to zoom in or out on the X-axis within a time range.
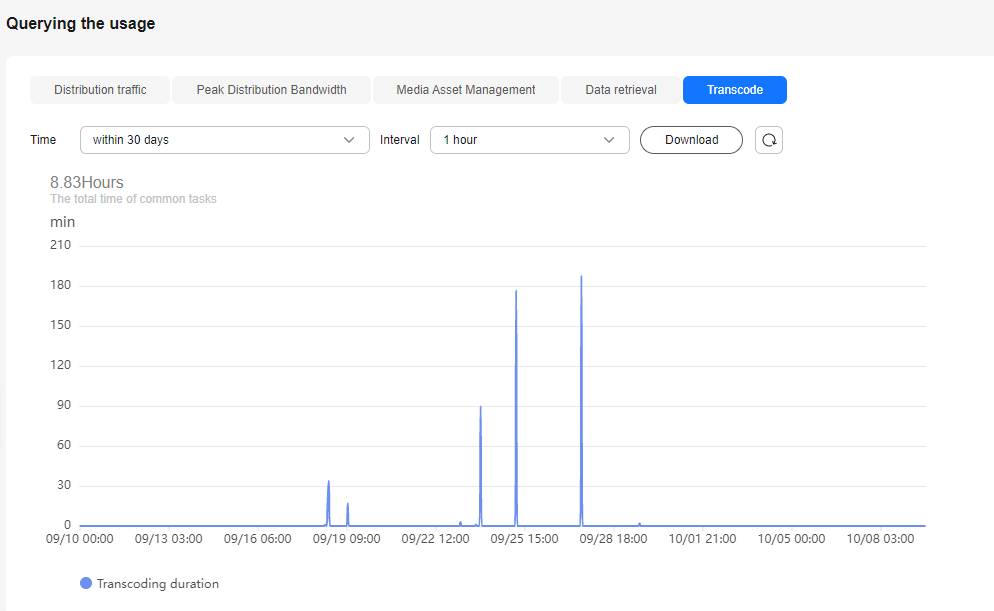
Transcoding
Select the time range and time granularity to view the total transcoding duration statistics of a media file.
You can click Download to export the total transcoding duration statistics of a media file to the local PC.
- You can query data of the past 30 days.
- The minimum statistical granularity is one hour. For example, data generated from November 6, 2020 08:00:00 (GMT+08:00) to November 6, 2020 09:00:00 (GMT+08:00) is displayed at the statistical point November 6, 2020 08:00:00 (GMT+08:00). The displayed data is the maximum value of the selected statistical granularity.
Feedback
Was this page helpful?
Provide feedbackThank you very much for your feedback. We will continue working to improve the documentation.See the reply and handling status in My Cloud VOC.
For any further questions, feel free to contact us through the chatbot.
Chatbot


