Bu sayfa henüz yerel dilinizde mevcut değildir. Daha fazla dil seçeneği eklemek için yoğun bir şekilde çalışıyoruz. Desteğiniz için teşekkür ederiz.
Overview
The Security Overview page gives you a comprehensive overview of your asset security posture in real time together with other linked cloud security services to collectively display security assessment findings. On the Security Overview page, you can view the security status of your cloud resources, take required actions with just a few clicks, and manage risks centrally.
On the Security Overview page, you can view the overall security posture of your assets and take actions accordingly. The Security Overview page consists of the following parts:
Security Score
The security score shows the overall health status of your workloads on the cloud based on the SA edition you are using. You can quickly learn about unhandled risks and their threats to your assets. Figure 1 shows an example.
- The score ranges from 0 to 100. The higher the security score, the more secure your assets. For details, see Security Score.
- Different color blocks in the security score ring chart indicate different severity levels. For example, yellow indicates that your security is medium.
- If you click Handle Now, the Risks pane is displayed on the right. You can handle risks by referring to the corresponding guidance.
- The Risks pane lists all threats that you should handle as soon as possible. Those threats are included in the Threat Alarms, Vulnerabilities, and Compliance Check areas.
- The Risks pane displays the latest alarms found in the last scan. The Events page shows all alarms found in all previous scans. So, you will find the threat number on the Risks pane is less than that on the Events page. You can click Handle for an alarm on the Risks pane to go to the Events page quickly.
- Handling detected security risks:
- In the Security Score area, click Handle Now. The Risks pane is displayed on the right.
- On the Risks pane, locate a risk and click Handle in the corresponding row. The Events page is displayed.
- Select one or more events in the Unhandled status and click Ignore or Mark as Offline above the result list to handle all selected events at a time.
- Ignore: If the event does not cause any harm, ignore the result. After click Ignore, record the Handler and Reason in the Ignore Risk dialog box.
- Mark as Offline: If the event has been handled offline, click Mark as Offline in the Operation column. In the displayed dialog box, fill in Processor, Processing Time, and Processing Result, and click OK.
- The security score is updated when you refresh the status of an alarm event after the risk is handled. After you address the risks, you can click Check Again so that SA can check and score your system again.
NOTE:
- It takes some time for a check to finish. You can refresh the page to get the new security score five minutes after you start the recheck.
- After risks are fixed, you can manually ignore or handle alarm events and update the alarm event status in the alarm list. The risk severity will then be downgraded accordingly.
- The security score reflects the security situation of your system last time you let SA check the system. To obtain the latest score, click Check Again.
Security Monitoring
The Security Monitoring area includes Threat Alarms, Vulnerabilities, and Compliance Check, which sort risks that have not been handled.

|
Parameter |
Description |
|---|---|
|
Threat Alarms |
This panel displays the unhandled threat alarms for the last 7 days. You can quickly learn of the total number of unhandled threat alarms and the number of vulnerabilities at each severity level.
|
|
Vulnerabilities |
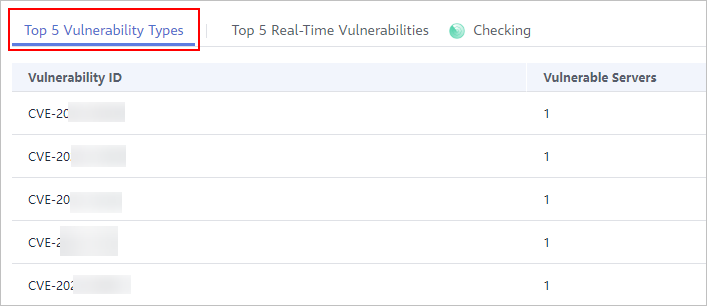
This panel displays the top five vulnerability types and the total number of unfixed vulnerabilities in your assets detected in the last 24 hours. You can quickly learn of the total number of unfixed vulnerabilities and the number of vulnerabilities at each severity level.
|
|
Compliance Check |
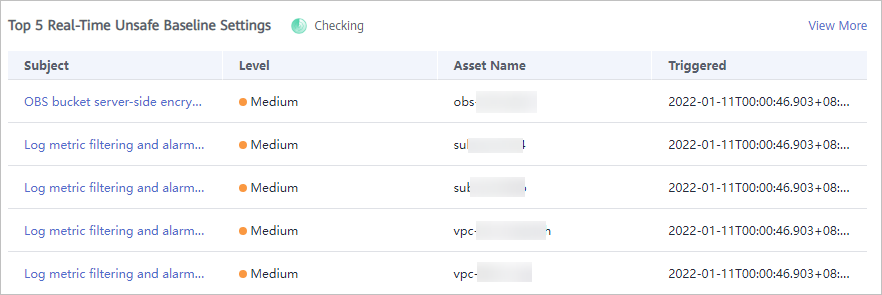
This panel displays the total number of compliance violations detected for the last 30 days. You can quickly learn of total number of violations and the number of violations at each severity level.
|
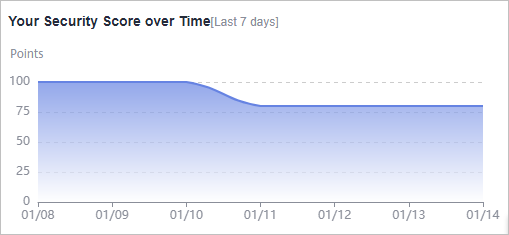
Your Security Score over Time
SA displays your security scores for the last 7 days.

Threat Detection
The Threat Detection area displays the number and types of alarms detected on your assets in the last seven days.
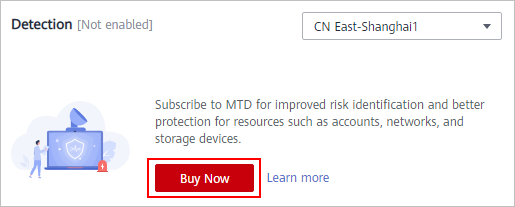
Managed Threat Detection (MTD) continuously scans for malicious activities and unauthorized behavior to protect your accounts and workloads. It integrates detection models, such as an AI detection engine, threat intelligence, and detection policies, to identify threats and generate detection reports. By analyzing the detection results, MTD improves the accuracy of alarm notifications and threat detection, and simplifies O&M.
If you want to use MTD to monitor access behavior and potential threats using access logs, to generate alarms, and output alarm results, subscribe to MTD. If MTD is not enabled, click Buy Now.

Feedback
Was this page helpful?
Provide feedbackThank you very much for your feedback. We will continue working to improve the documentation.See the reply and handling status in My Cloud VOC.
For any further questions, feel free to contact us through the chatbot.
Chatbot


