Managing Storage Capacity
Scenarios
RDS for SQL Server provides space monitoring and analysis by instance, database, and even table, helping you quickly learn about space information and identify space problems.
Overview
- Click
 in the upper left corner and select a region.
 - Click
 in the upper left corner of the page and choose Databases > Relational Database Service.
 - On the Instances page, click the target DB instance name.
- In the navigation pane, choose Storage Analysis under DBA Assistant.
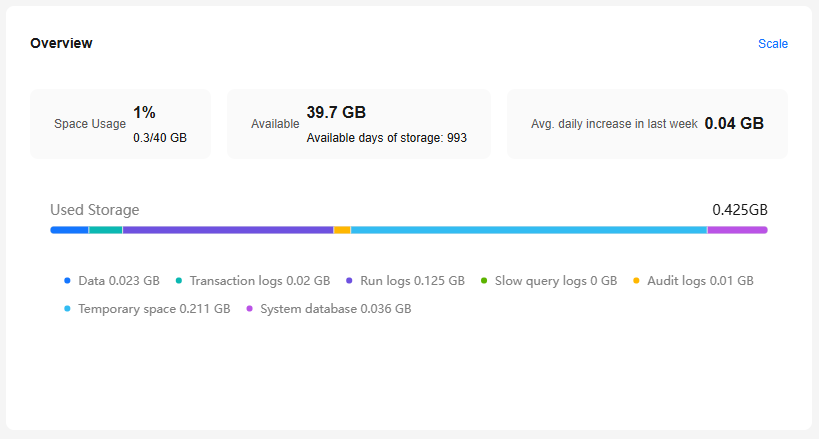
- On the Storage Analysis page, view storage usage. If your storage is insufficient, scale it up. Figure 1 Overview

Table 1 Parameter description Parameter
Description
Storage Usage
Storage usage of the DB instance.
Available
Available storage space of the DB instance.
Available days of storage
Estimated number of days that the remaining storage space can be used.
Avg. daily increase in last week
Average daily increase in storage usage in the last seven days.
Used Storage
Storage space distribution. For details, see Table 2.
Table 2 Disk space distribution parameters Parameter
Description
Data
Total space occupied by data files.
Transaction logs
Total space occupied by transaction logs.
Run logs
Total space occupied by run logs.
Slow query logs
Total space occupied by slow query logs.
Audit logs
Total space occupied by audit logs.
Temporary space
Total space of the tempdb database.
System database
Total space of system database msdb.
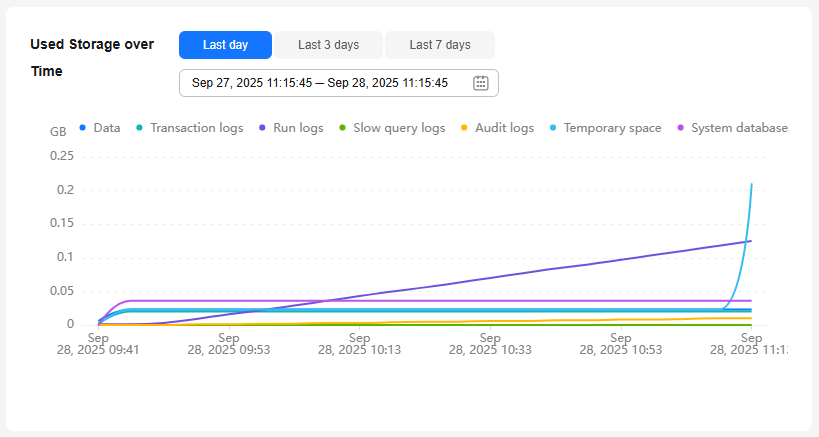
Used Storage over Time
You can check the storage usage over time of your instance.

Top 20 Databases
You can view details about the top 20 databases by physical file size, including file information.

| Parameter | Description |
|---|---|
| Database | Database name. |
| Status | Database status. |
| Total(MB) | Total space of the database, in MB. |
| Used(MB) | Used space of the database, in MB. |
| Available(MB) | Available space of the database, in MB. |
| Used by Logs(MB) | Space used by transaction logs in the database, in MB. |
| Available to Logs(MB) | Space available to transaction logs in the database, in MB. |
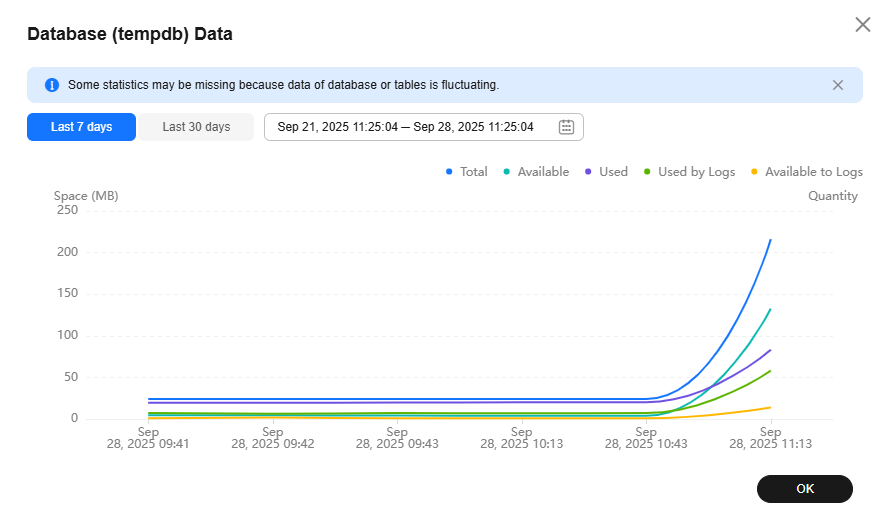
- You can click View Chart in the database list to view database space changes in the last 7 days, last 30 days, or a custom time period. Figure 4 Database data

- You can click
 in front of a database to expand the list of files contained in the database.
 Table 4 File list parameters Parameter
Description
File Group
Name of the file group where the file is located. The file group of log files is NULL.
File Type
Type of the file, which can be Data, Log, or Filestream.
File Name
Name of the file.
Total(MB)
Total space of the file, in MB.
Used space(MB)
Used space of the file, in MB.
Available(MB)
Available space of the file, in MB.
Max. File Size(MB)
Maximum file space, in MB. The value -1 indicates that the file space is not limited.
Automatic File Growth
Automatic growth of the file, in MB or percentage.
In the file list, you can select one or more files and click Shrink Files to shrink the files. (This operation is not allowed for the master, msdb, model, and rdsadmin databases.)
Figure 5 Shrinking files
Top 20 Tables
You can view details about the top 20 tables by physical file size. Tables whose names contain non-English character sets cannot be displayed.
| Parameter | Description |
|---|---|
| Table Name | Name of the table. |
| Reserved(MB) | Total space reserved for the table. |
| Data Space(MB) | Total space occupied by table data. |
| Index Space(MB) | Total space occupied by table indexes. |
| Available(MB) | Available space of the table. |
| Rows | Total number of rows in the table. |
| Indexes | Number of indexes created in the table. |
| Created | Time when the table is created. The format is affected by the character set of the instance. |
You can click View Chart in the table list to view tablespace changes in the last 7 days, last 30 days, or a custom time period.
Feedback
Was this page helpful?
Provide feedbackThank you very much for your feedback. We will continue working to improve the documentation.See the reply and handling status in My Cloud VOC.
For any further questions, feel free to contact us through the chatbot.
Chatbot


