Access Logging
Scenarios
Global Accelerator logs requests sent to listeners, including the time when the request was sent, client IP address, request path, and server response.
Constraints
Log Tank Service (LTS) is a regional service. You can enable access logging for Global Accelerator in CN North-Beijing4 and AP-Singapore as needed.
To enable access logging, you need to interconnect Global Accelerator with LTS and create a log group and a log stream on the LTS console by following the instructions in the Log Tank Service User Guide.
Configuring LTS
- Create a log group.
- Log in to the management console.
- In the upper left corner of the page, click
 and select the desired region and project.
 - In the upper left corner of the page, click
 and select Log Tank Service under Management & Governance.
- In the navigation pane on the left, choose Log Management.
- Click Create Log Group. In the displayed dialog box, enter a name for the log group.
Set Log Retention Duration as required.
- Click OK.
- Create a log stream.
- On the LTS console, click
 on the left of a log group name.
 - Click Create Log Stream. In the displayed dialog box, enter a name for the log stream.
- Select an enterprise project as required.
- Click OK.
- On the LTS console, click
Configuring Access Logging
- Log in to the Global Accelerator console.
- Click the name of the global accelerator to go to the details page.
- Click Access Logs.
- Click Configure Access Logging.
- Enable access logging and select the log group and log stream you created.
- Click OK.
Viewing Access Logs
- Log in to the Global Accelerator console.
- Click the name of the global accelerator to go to the details page.
- Click Access Logs.
- In the access log list, locate the target access log and click View Log Details.
On the displayed page, view the information about the log group and log stream.
- Click the name of the log stream and view its details.
The following is an example log. For details about the fields in the log, see Table 1. The log format cannot be modified.
{
       "content": "conn_state_time:$value, conn_type: $value, conn_state: $value, proto: $value, client_ip: $value, client_port: $value, listener_ip: $value, local_ip: $value, local_port: $value, dest_ip: $value, dest_port: $value ",
       "_resource_id": "$value ",
       "_resource_name": "LISTENER",
       "_service_type": "GA",
       "category": "LTS",
       "collectTime": $value
}
Table 1 Parameter description Parameter
Description
Value Description
Example Value
conn_state_time
Session creation/aging time
String
2024-01-02 09:22:56
conn_type
Session type recorded in the flow log
CREATE: information about new connections
EXPIRE: information about expired connections
CREATE
conn_state
Session status when a session is recorded
String
ESTABLISHED
proto
The protocol type of a session
TCP: TCP connections
UDP: UDP connections
TCP
client_ip
Source IP address of a session
IP address
127.0.0.1
client_port
Source port of a session
Port number
12345
listener_ip
IP address used by the accelerator
IP address
127.0.0.1
local_ip
The IP address used to communicate with endpoints
IP address
127.0.0.1
local_port
The port used to communicate with endpoints
Port number
24687
dest_ip
The IP address used by the endpoint
IP address
127.0.0.1
dest_port
The port of the endpoint
Port number
80
_resource_id
Resource ID
uuid
95c2b814-99dc-939a-e811-ae84c61ea9ee
_resource_name
Resource type
Fixed value: LISTENER
LISTENER
_service_type
Service corresponding to the flow log.
Fixed value: GA
GA
category
Log category
Fixed value: LTS
LTS
collectTime
LTS log collection time
Integer
1704158708902
Configuring Log Transfer
If you want to analyze access logs later, transfer the logs to OBS for storage.
- Log in to the management console.
- In the upper left corner of the page, click
 and select the desired region and project.
 - In the upper left corner of the page, click
 and select Log Tank Service under Management & Governance.
- In the navigation pane on the left, choose Log Transfer.
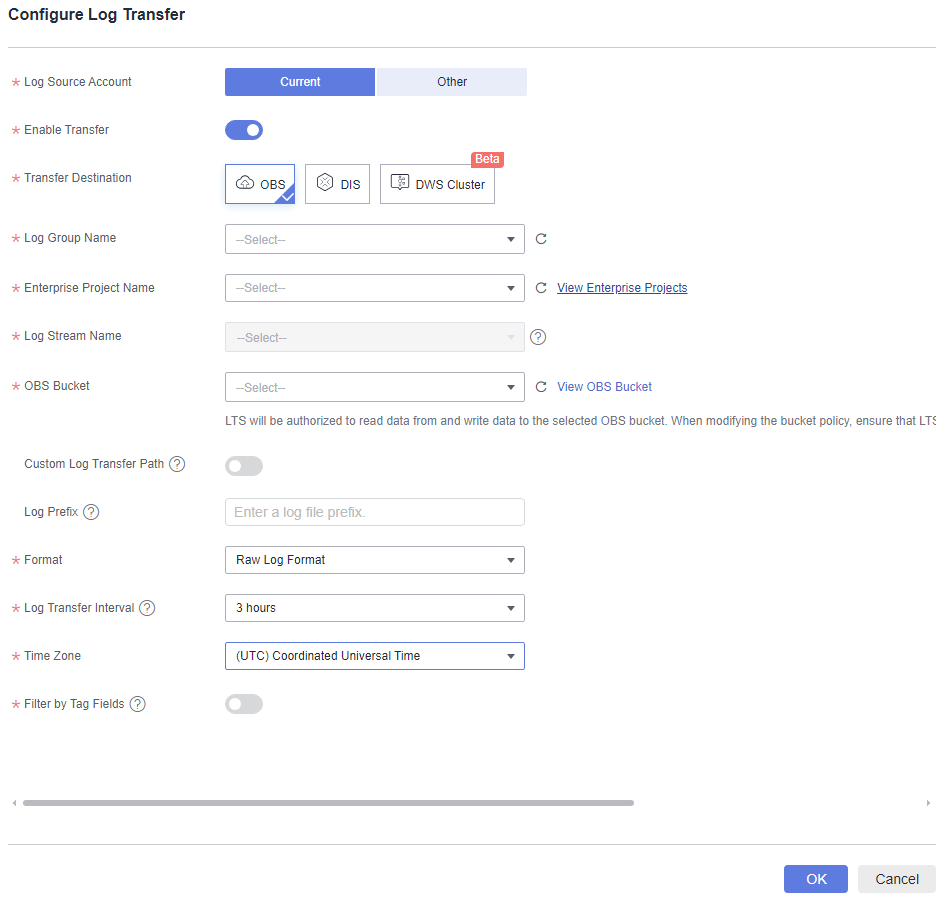
- On the Log Transfer page, click Configure Log Transfer in the upper right corner.
Figure 1 Configuring log transfer

- Configure the parameters. For details, see the Log Tank Service User Guide.
Feedback
Was this page helpful?
Provide feedbackThank you very much for your feedback. We will continue working to improve the documentation.See the reply and handling status in My Cloud VOC.
For any further questions, feel free to contact us through the chatbot.
Chatbot


