Viewing Alert Details
Once asset protection is enabled for application data assets, alert logs are generated for any risky access. You can view these alert logs to promptly detect risks to application data assets.
Procedure
- Log in to the web console of the API data security protection system as user sysadmin.
- In the navigation pane, choose .
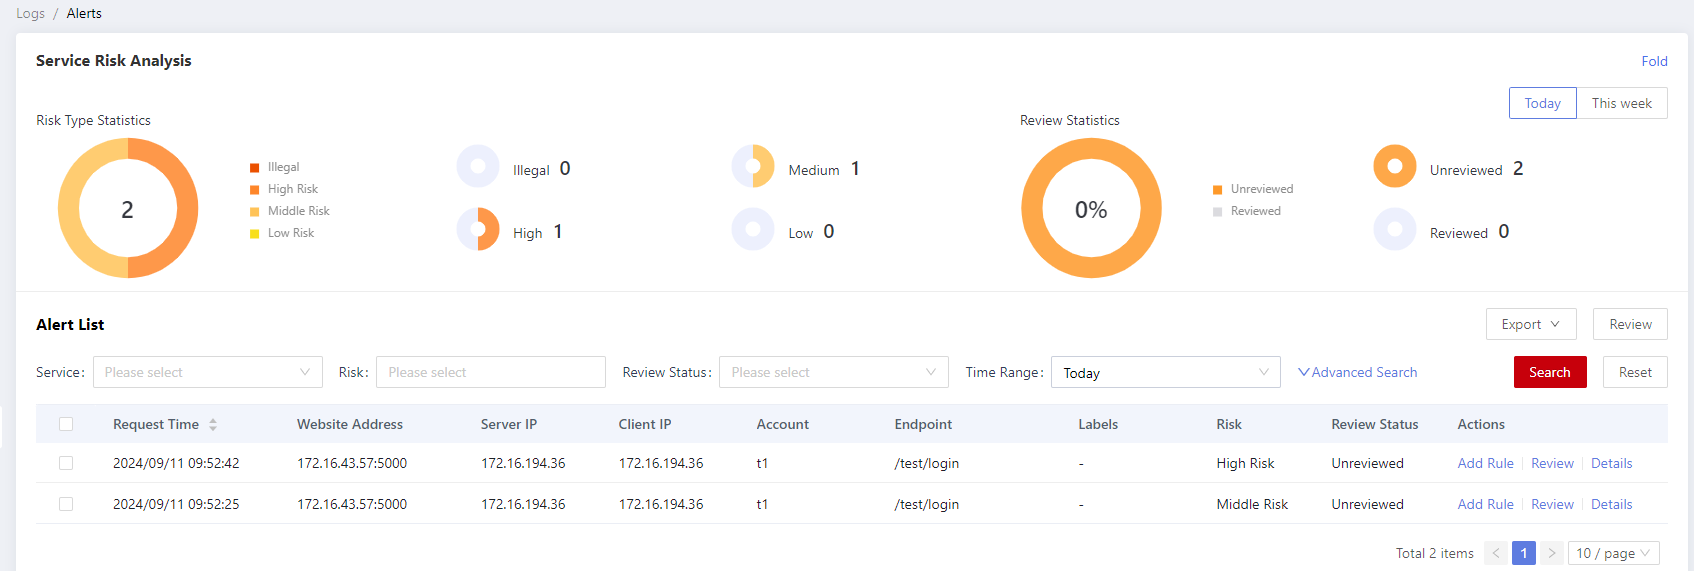
- On the Alerts page, view the alert statistics, as shown in Alert statistics. For details about the parameters, see Alert statistics.
Table 1 Alert statistics Area
Description
Risk type statistics
Displays the alert statistics of the illegal, high-risk, medium-risk, and low-risk levels in a ring chart.
Review statistics
Displays the number of reviewed and unreviewed alerts in a ring chart.
Search criteria
You can search for alerts based on search criteria. Default search criteria and advanced search are supported.
Alert list
Detailed alert information shown in a list.
- (Optional) In the alert list, click Details to view details about an alert log.
- (Optional) To download alert logs to the local PC, click Export.
Related Operations
You can review and confirm alerts. For details, see Reviewing Alert Logs.
If there is an errored alarm, you can configure audit and protection policies based on the alarm. For details, see Configuring a Policy on the Alerts Page.
Feedback
Was this page helpful?
Provide feedbackThank you very much for your feedback. We will continue working to improve the documentation.See the reply and handling status in My Cloud VOC.
For any further questions, feel free to contact us through the chatbot.
Chatbot


