
Help Center/
Data Security Center/
User Guide/
API Data Security Protection/
System Administrator Operation Guide/
Viewing the Home Page
Updated on 2025-12-04 GMT+08:00
Viewing the Home Page
After you log in to the system as the system administrator, the Overview page is displayed. On this page, you can learn about the assets and risks of API data security protection. You can select a time range tab in the upper left corner and view information for over Last 7 days or Last 30 days.
Checking Details on the Overview Page
The overview page displays system statistics in a visualized panel.
- Log in to the web console of the API data security protection system as user sysadmin.
- In the navigation pane on the left, choose Home > Overview.
- On the Overview page, view the asset overview statistics.
Figure 1 Overview
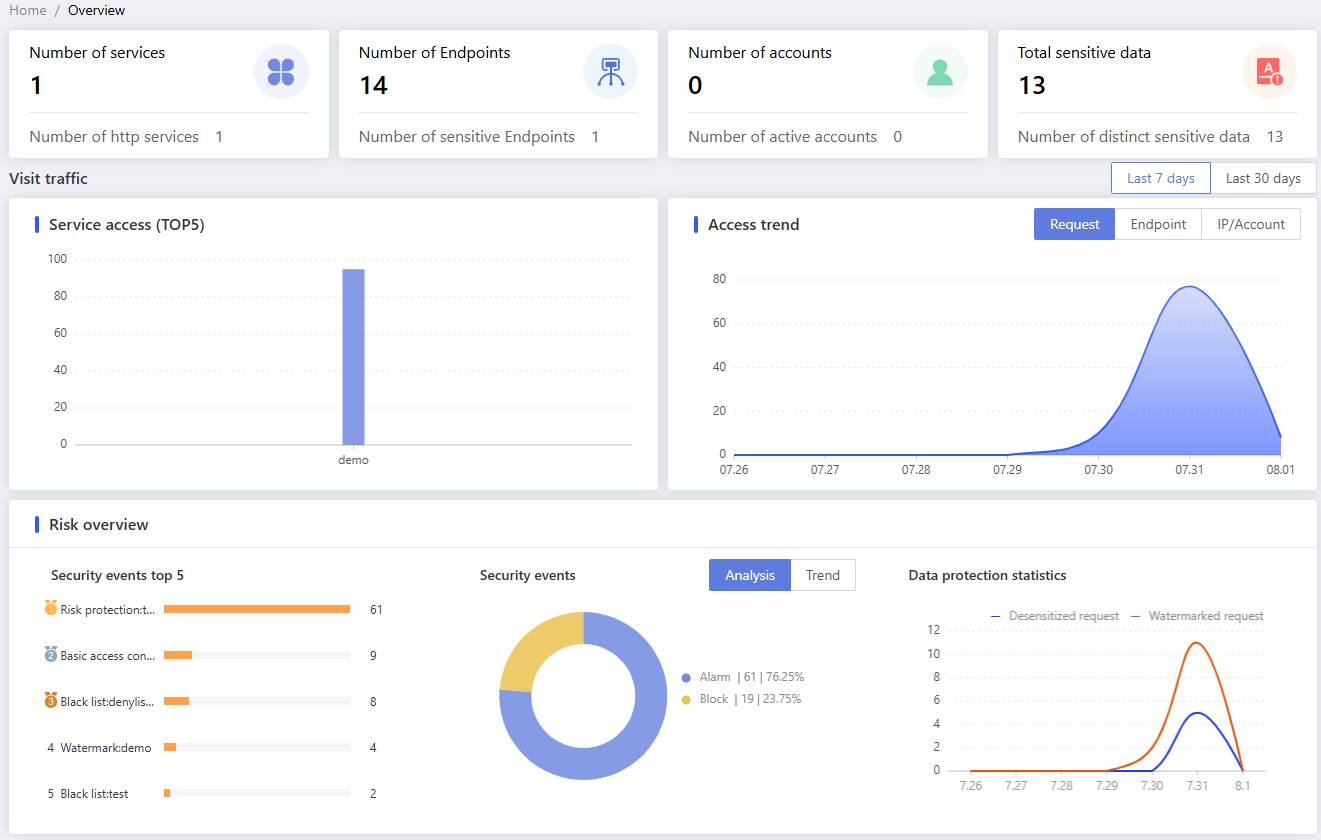
Table 1 Panels under Overview Area
Description
Assets
The data asset statistics are displayed.- Number of services: the total number of application assets to be audited.
- Number of Endpoints: the total number of endpoints of all applications.
- Total sensitive data : the number of sensitive data records of all applications.
- Number of accounts: the total number of login accounts of all applications to be audited.
Visit traffic
This area displays statistics on the access popularity of application assets within the selected time range.- Service access (TOP 5): displays the top 5 applications that are accesses most.
- Access trend: displays the application access trend over the selected time range.
Risk overview
This area displays statistics on the application asset risks within the selected time range.- Security events top 5: displays the top 5 risk rules that are triggered most.
- Security events Analysis/Trend: displays the response type and trend of security events in the selected time range, respectively.
- Data protection statistics: displays the request trend of the masking and watermarking services in the selected time range.
Feedback
Was this page helpful?
Provide feedbackThank you very much for your feedback. We will continue working to improve the documentation.See the reply and handling status in My Cloud VOC.
The system is busy. Please try again later.
For any further questions, feel free to contact us through the chatbot.
Chatbot


