Viewing Data Quality Reports
You can query the quality reports of business metrics and data objects to determine whether their quality meets the requirements.

Quality reports include technical reports and business reports.
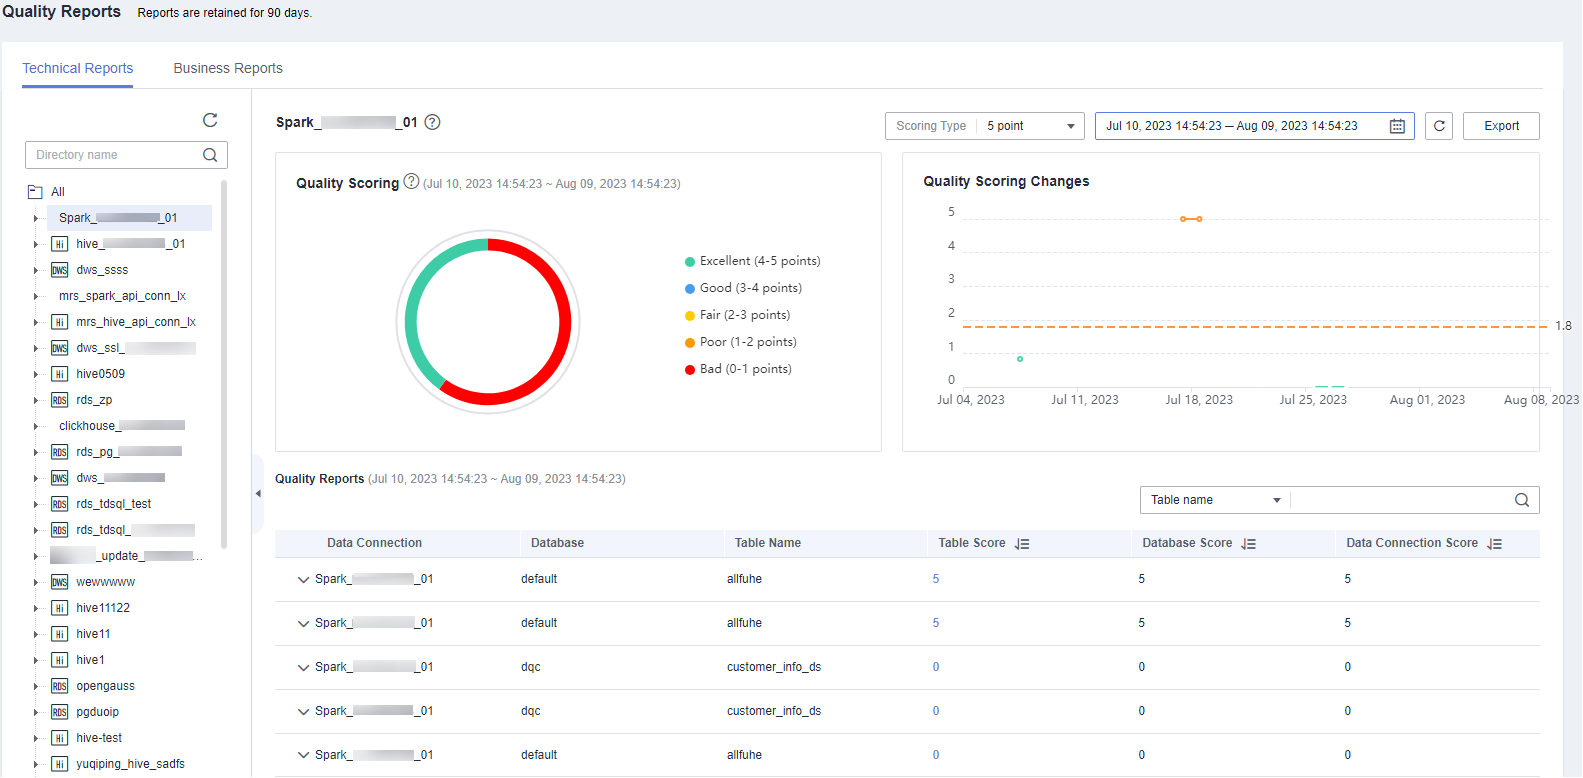
Technical reports measure the execution results of quality jobs and contain data connections, databases, table names, and scores.
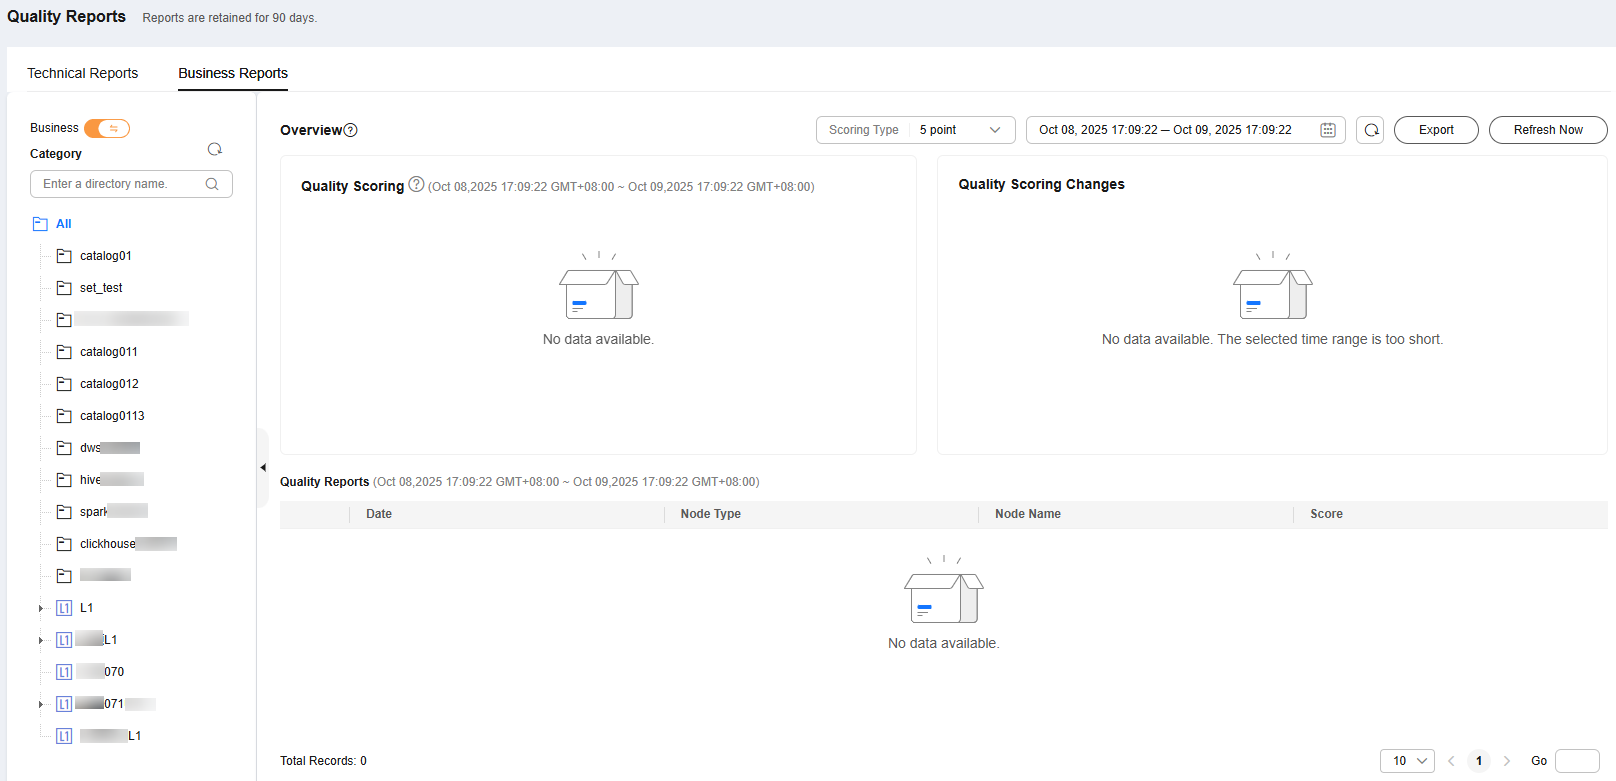
Business reports measure the execution results of quality jobs associated with subjects in DataArts Architecture and contain subject area groups, subject areas, business objects, table names, and scores.
Viewing Data Quality Scores in a Technical Report
The full quality score can be set to 5, 10, or 100 points. By default, a five-point scale is used for quality scoring based on table-associated rules. Scores in different dimensions, such as tables and databases, are calculated based on the weighted average values of rule scores in different dimensions.
You can query the scores of databases, tables, and table-associated rules. For details on the calculation formulas, see Table 1.
- On the DataArts Studio console, locate a workspace and click DataArts Quality.
- Choose in the left navigation bar.
- On the Technical Reports page, select a data connection and set a time range (a maximum of 30 days).
Figure 1 Selecting a data connection


- Take the full score 5 points as an example. Points 4 to 5: excellent; 3 to 4: good; 2 to 3: unqualified; 1 to 2: poor; 0 to 1: very poor.
- The quality score data of a day is generated in the early morning of the next day.
- In the Quality Scoring Changes area, the solid line consists of the quality scores of the end date and the previous seven days, and the dashed line indicates the average quality score of these days.
- If the job is executed multiple times on a day, the last score is used as the quality score of the day.
- Click the score link in the Table Score column to expand the scores of the rules associated with the table.
Figure 2 Viewing the rule score


The rule name is the name of the running instance. If a job runs multiple times, the name of the latest instance is used. If a running instance contains multiple sub-instances, each sub-instance has a record.
- Click the score link in the Rule Score column to expand the scores of the fields associated with the rule.
Figure 3 Table-associated rule scores

Viewing Business Quality Scores in a Business Report
The full quality score can be set to 5, 10, or 100 points. By default, a five-point scale is used for quality scoring based on table-associated rules. The scores in different dimensions, such as tables, business objects, and subject areas, are calculated based on the weighted average values of rule scores in different dimensions.
You can query the quality scores of subject area groups, subject areas, business objects, tables, and table-associated rules. For details on the calculation formulas, see Table 2.
- On the DataArts Studio console, locate a workspace and click DataArts Quality.
- Choose in the left navigation bar.
- Click the Business Reports tab, and select a subject and an end date to query the quality scores of the end date and the previous seven days.
Figure 4 Business object


- Take the full score 5 points as an example. Points 4 to 5: excellent; 3 to 4: good; 2 to 3: fair; 1 to 2: qualified; 0 to 1: unqualified.
- The quality score data of a day is generated in the early morning of the next day.
- In the Quality Scoring Changes area, the solid line consists of the quality scores of the end date and the previous seven days, and the dashed line indicates the average quality score of these days.
- If the job is executed multiple times on a day, the last score is used as the quality score of the day.
- You can use the toggle to switch between the business score report and catalog score report.
- Click the score link in the Table Score column to expand the scores of the rules associated with the table.
- Click the score link in the Rule Score column to expand the scores of the fields associated with the rule.
Figure 5 Table-associated rule field scores

Exporting Quality Reports
You can export a quality report in either of the following ways:
- If the OBS service is available, the data is exported to the associated OBS bucket by default.

- As quality reports contain a large amount of data, a single exported file can contain a maximum of 2,000 fields. Therefore, there may be multiple exported files in the OBS bucket.
- The exported report is available only in the current workspace.
- If the OBS service is unavailable, the data is exported to a local path by default.
- On the DataArts Studio console, locate a workspace and click DataArts Quality.
- Choose in the left navigation bar.
Figure 6 Quality Reports page

- In the upper right corner of the page, click Export.
Figure 7 Export
 Figure 8 Export to OBS
- Click the Export Records tab to view the export result. You can click Download to download a report. If the exported report file is too large, you can directly download the file.
Figure 9 Export Records

Refreshing Data Immediately
After a quality job and a comparison job are complete, you can refresh data immediately to obtain the temporary data quality report from 00:00 to the current time. In the early morning of the next day, the quality report scheduling task starts to be executed, which generates the full data quality report for the previous day.
- On the DataArts Studio console, locate a workspace and click DataArts Quality.
- Choose in the left navigation bar.
- Click Refresh Now in the upper right corner. The page displays the temporary data generated from 00:00 to the current time. You can immediately obtain the data quality report of the current day.
Figure 10 Refresh Now

Feedback
Was this page helpful?
Provide feedbackThank you very much for your feedback. We will continue working to improve the documentation.See the reply and handling status in My Cloud VOC.
For any further questions, feel free to contact us through the chatbot.
Chatbot


