Help Center/
Cloud Certificate & Manager/
SSL Certificate Manager (SCM) User Guide/
Monitoring and Auditing/
Operation Trace Management/
Viewing Audit Logs
Updated on 2025-09-30 GMT+08:00
Viewing Audit Logs
Once CTS is enabled, the system starts recording operations on CCM. Operation records generated during the last seven days can be viewed on the CTS console.
Viewing an SCM Trace on the CTS Console
- Log in to the CCM console.
- In the navigation pane on the left, click
 and choose . The CTS console is displayed.
 - Choose Trace List in the navigation pane on the left.
- The search box above the trace list supports advanced queries. Combine one or more filters to refine your search.
- Trace Name, Trace ID, Resource Name, Resource ID, Cloud Service, Resource Type, Operator, Trace Status, Enterprise Project ID, Access Key, and Time Range.
Select an option from the drop-down list.
- Resource Type: Select SCM.
- Cloud Service: Select CCM.
- If you select Trace Name, you need to select a specific event name. If you select Resource ID, you need to select or manually enter a specific resource ID. If you select Resource Name, you need to select or manually enter a specific resource name. If you select Trace ID, you need to select or manually enter a specific event ID.
- Operator: Select a specific operator (a user rather than tenant).
- Trace Status: Select normal, warning, or incident.
- Enterprise Project ID: Enter an enterprise project ID.
- Access Key: Enter a temporary or permanent access key ID.
- Time Range: In the upper left corner of the page, you can query traces in the last 1 hour, last 1 day, last 1 week, or within a customized period.
- Trace Name, Trace ID, Resource Name, Resource ID, Cloud Service, Resource Type, Operator, Trace Status, Enterprise Project ID, Access Key, and Time Range.
- View the corresponding operation event.
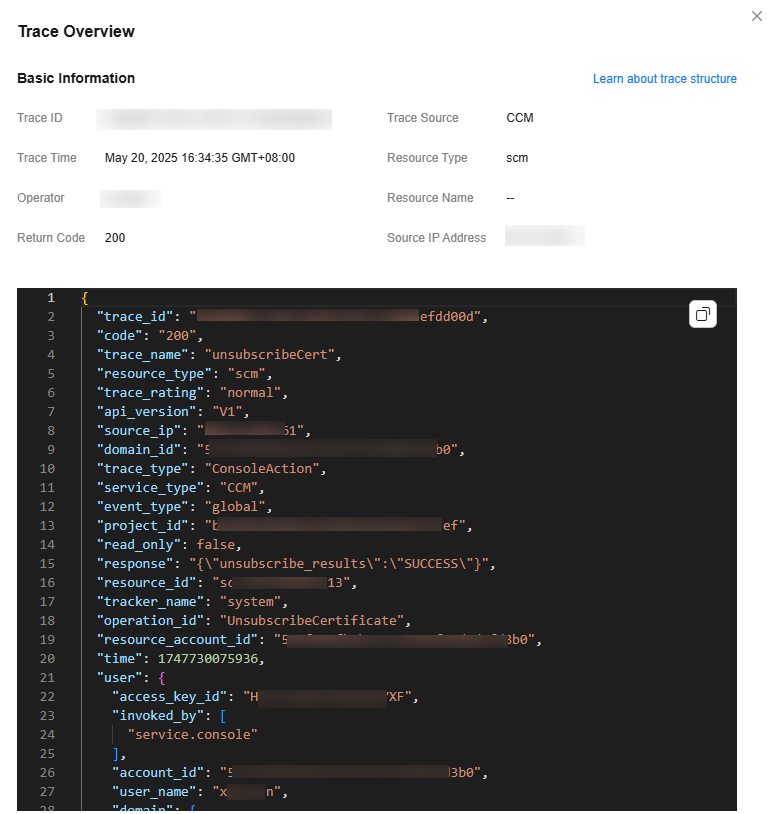
- Click Trace Name on the left of the record to be viewed. The Trace Overview dialog box is displayed on the right, showing the basic information about the record, as shown in Figure 1.
Parent topic: Operation Trace Management
Feedback
Was this page helpful?
Provide feedbackThank you very much for your feedback. We will continue working to improve the documentation.See the reply and handling status in My Cloud VOC.
The system is busy. Please try again later.
For any further questions, feel free to contact us through the chatbot.
Chatbot


