
Why Can't I View the Monitoring Data of a RabbitMQ Instance?
RabbitMQ 3.x.x Instance
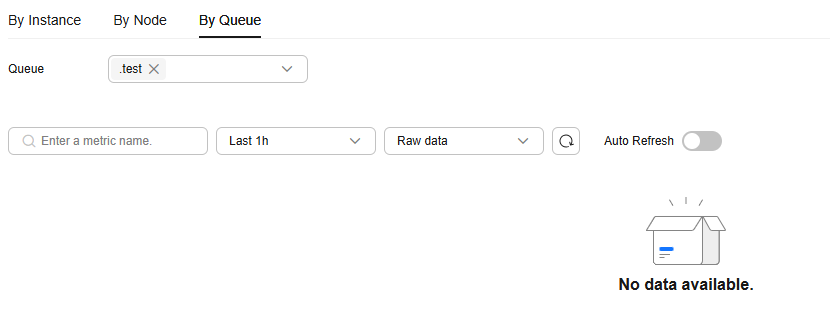
Monitoring data may fail to be displayed if the queue name or virtual host name of a RabbitMQ 3.x.x instance meets any of the following conditions:
- The queue name starts with a special character, for example, a period (.). You are advised to delete queues whose names contain special characters.
- The virtual host name starts with a special character, for example, a period (.). You are advised to delete virtual hosts whose names contain special characters The queue name of a RabbitMQ 3.x.x instance is displayed in two ways on the monitoring page. The name of a queue is displayed if the queue is on the default virtual host. If a queue is not on the default virtual host, the queue name is displayed in the format "Name of the virtual host where the queue is__Queue name". For example, if the test01 queue is on Vhost-13142708, the queue name displayed on the monitoring page is Vhost-13142708__test01.
- On Cloud Eye, a special character (.) is counted as five characters. If the name of a queue or virtual host contains periods (.) and the counted total length exceeds 256 characters, the monitoring data cannot be displayed. You are advised to delete queues or virtual hosts whose names contain periods (.).
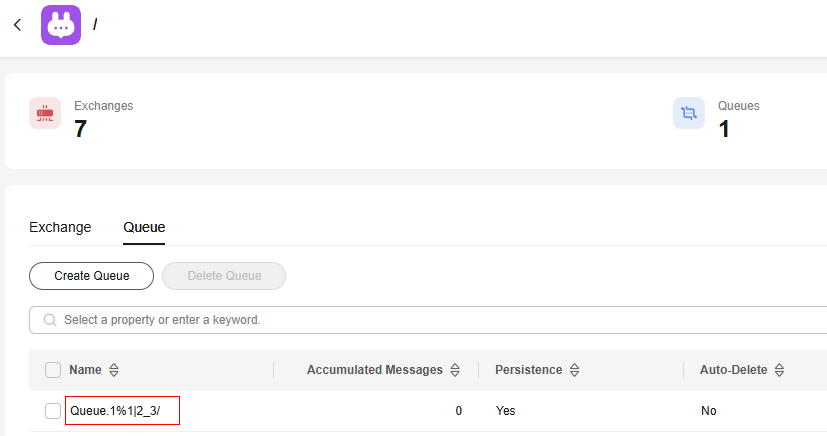
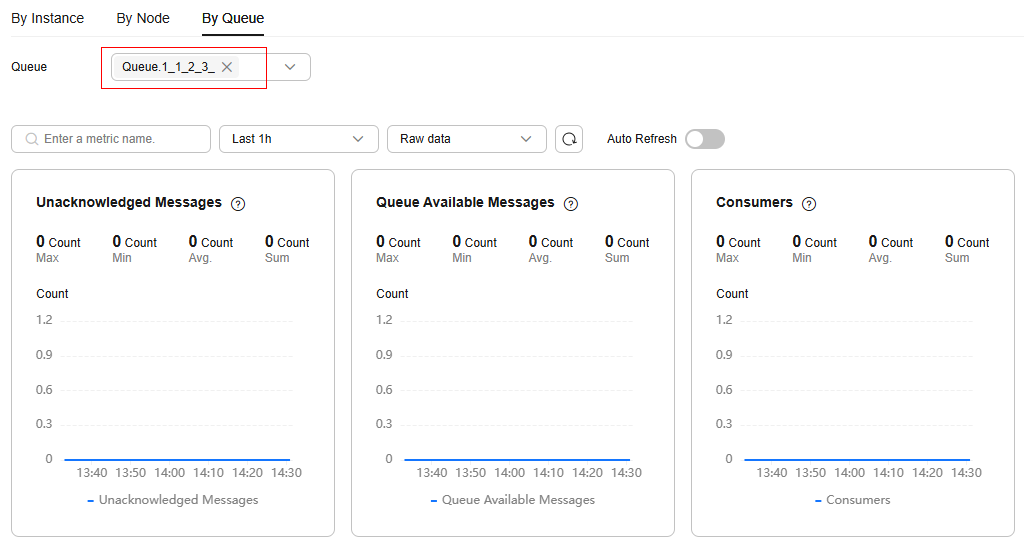
When the queue or virtual host name of a RabbitMQ 3.x.x instance contains special characters, such as %, |, and /, the special characters are displayed as underscores (_) on the monitoring page. For example, the name of queue Queue.1%1|2_3/ in the default virtual host is displayed as Queue.1_1_2_3_ on the monitoring page.
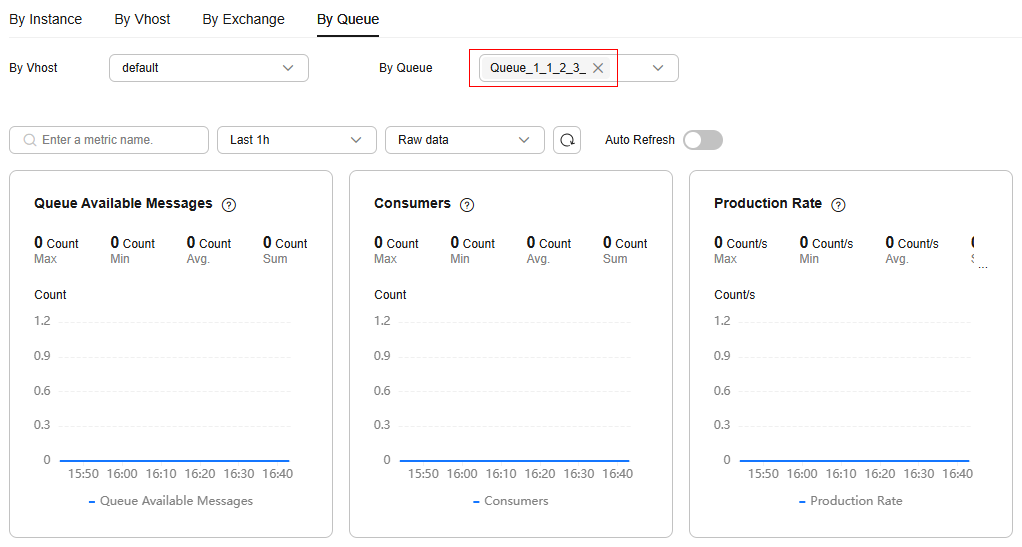
RabbitMQ AMQP-0-9-1 Instance
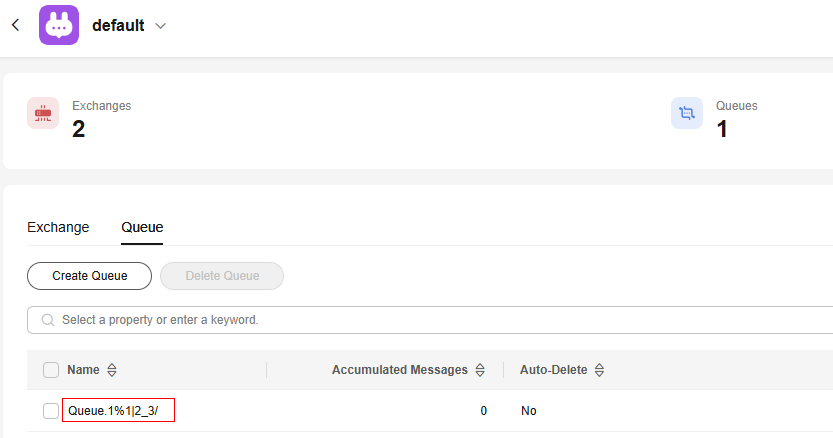
When the Queue, virtual host, or exchange name of a RabbitMQ AMQP-0-9-1 instance contains special characters, such as %, |, /, and ., the special characters are displayed as underscores (_) on the monitoring page. For example, the name of queue Queue.1%1|2_3/ is displayed as Queue_1_1_2_3_ on the monitoring page.
Feedback
Was this page helpful?
Provide feedbackThank you very much for your feedback. We will continue working to improve the documentation.See the reply and handling status in My Cloud VOC.
For any further questions, feel free to contact us through the chatbot.
Chatbot


