How Do I Determine Whether the Pangu Model Training Status Is Normal?
You can observe the loss curve trend (loss function value changes) during training to determine whether the training status is normal. The loss function is a metric that measures the difference between the predicted and actual outputs of a model. In normal cases, a smaller value indicates better model performance.
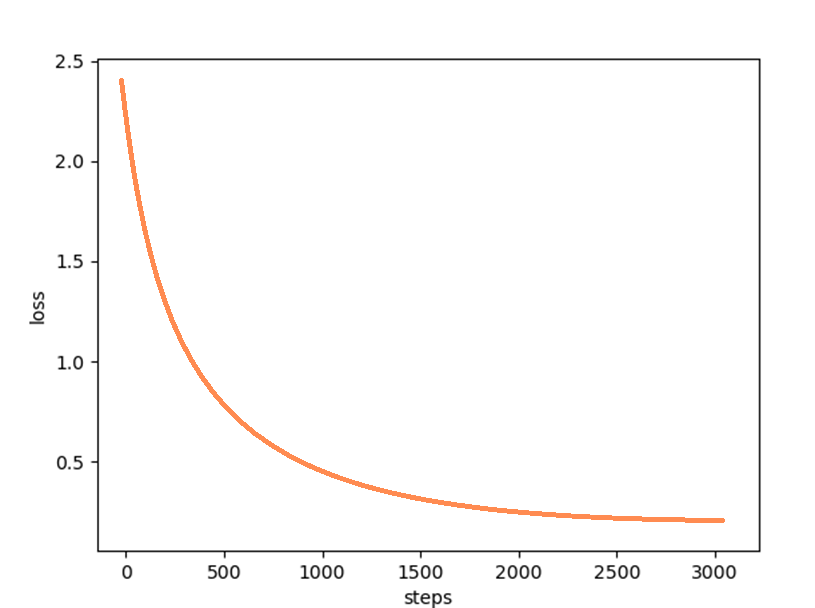
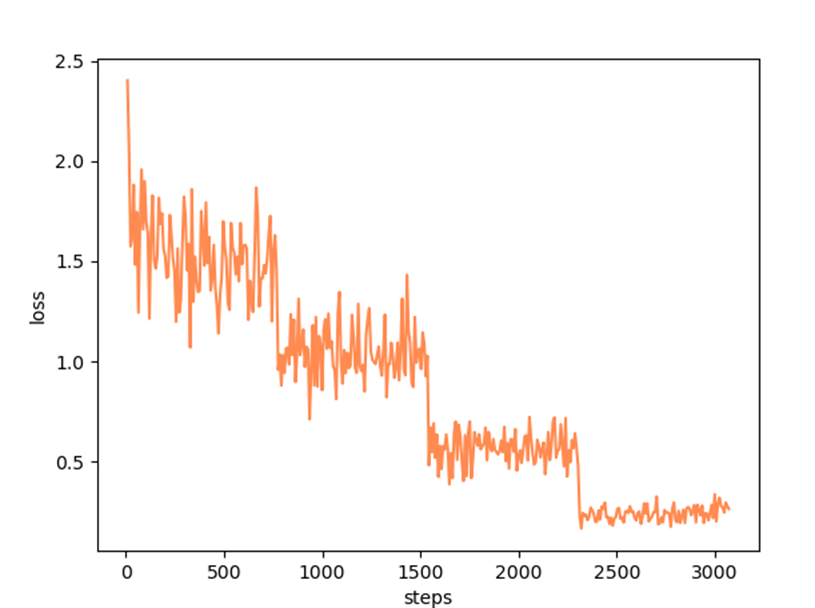
You can obtain the loss of each step from the training logs on the platform and draw a loss curve to observe the change trend. Generally, a normal loss curve should be monotonically decreasing. That is, as the training proceeds, the loss value decreases continuously until it converges to a smaller value.
The following figures show several loss curves.
If the following situations occur on the loss curve, the training status may be abnormal:
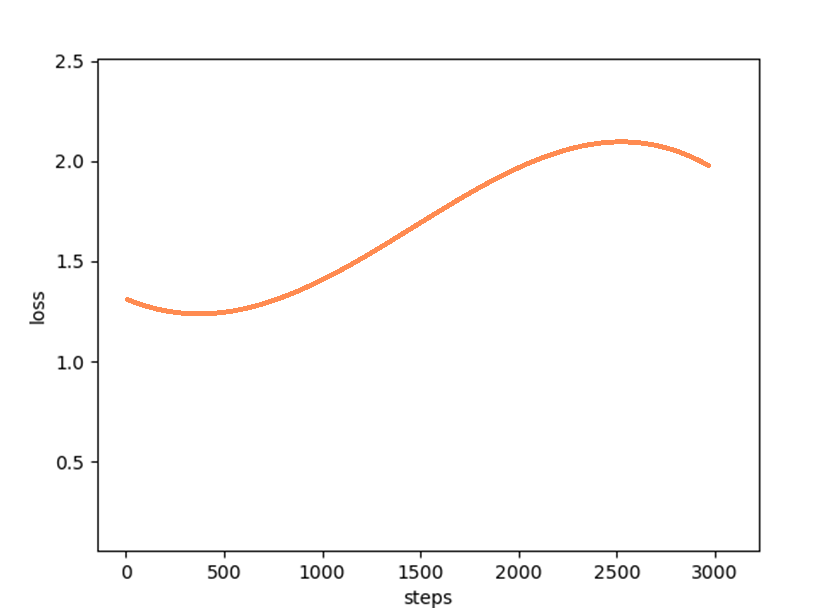
- The loss curve increases. The possible cause is that the data quality is poor or the learning rate is too large. As a result, the model flaps around the optimal solution or even overshoots the optimal solution. As a result, the model fails to converge. You can try to improve the data quality or reduce the learning rate.
Figure 3 Abnormal loss curve: increase
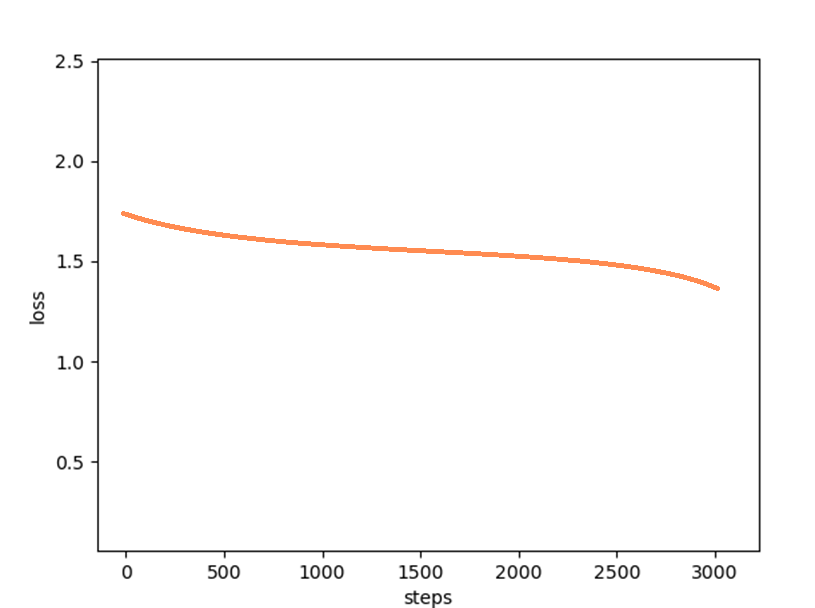
- The loss curve is smooth but remains high. The possible cause is that the target task is difficult or the learning rate of the model is too small. As a result, the model converges slowly and cannot achieve the optimal solution. You can try to increase the number of epochs or the learning rate.
Figure 4 Abnormal loss curve: smooth but high
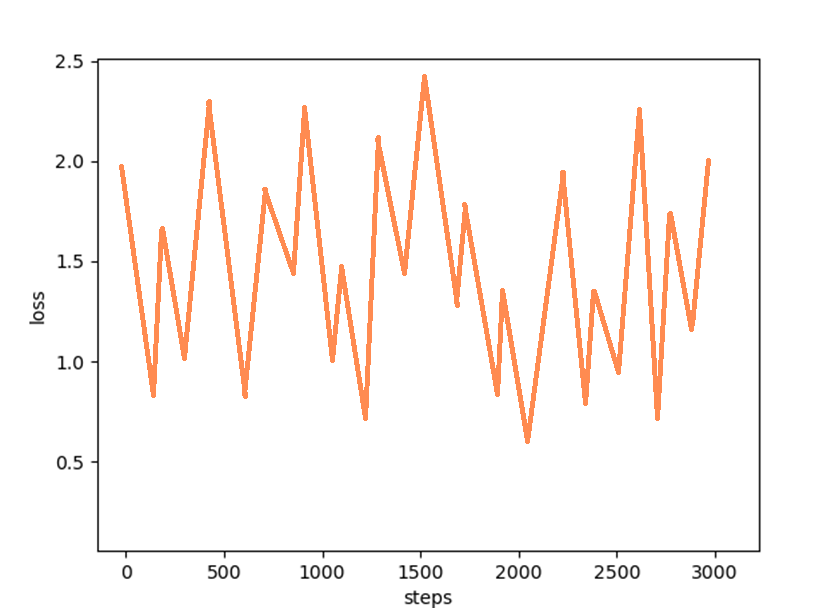
- The loss curve jitters abnormally. The possible cause is poor data quality. For example, the data has noise or is unevenly distributed. As a result, the training process is unstable. You can try to improve data quality.
Figure 5 Abnormal loss curve: abnormal jitter
Feedback
Was this page helpful?
Provide feedbackThank you very much for your feedback. We will continue working to improve the documentation.See the reply and handling status in My Cloud VOC.
For any further questions, feel free to contact us through the chatbot.
Chatbot


