
(New) Graphs
Dashboard graphs show the query and analysis results of metrics.
Metric Data Graphs
The following types of graphs are supported: line graphs, digit graphs, top N graphs, tables, bars, and digital line graphs.
- Line graph: used to analyze the data change trend in a certain period. Use this type of graph when you need to monitor the metric data trend of one or more resources within a period.
You can use a line graph to compare the same metric of different resources. The following figure shows the CPU usage of different hosts.
Figure 1 Line graph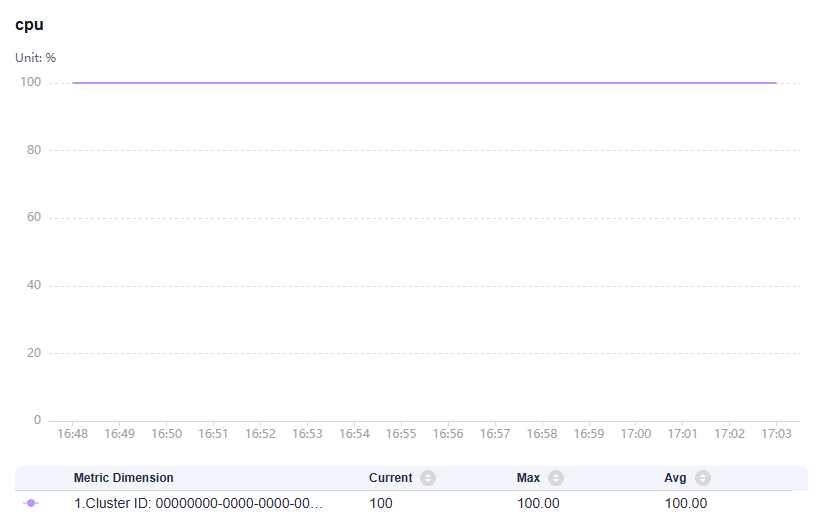
Table 1 Line graph parameters Category
Parameter
Description
Graphics
Line Shape
Line type. Options: Straight and Curved.
Display Background
If this option is enabled, the background will be displayed in the line graph.
Top Margin
Distance between the axis and the upper boundary of the graph.
Bottom Margin
Distance between the axis and the lower boundary of the graph.
Left Margin
Distance between the axis and the left boundary of the graph.
Right Margin
Distance between the axis and the right boundary of the graph.
X Axis
Show
Whether to display the X axis.
X Axis Title
Title of the X axis.
Y Axis
Show
Whether to display the Y axis.
Y Axis Title
Title of the Y axis.
Y Axis Range
Value range of the Y axis.
- Digit Graph: used to highlight a single value. Use this type of graph to monitor the latest value of a metric in real time.
In the following figure, you can view the CPU usage of a host in real time.
Figure 2 Digit graph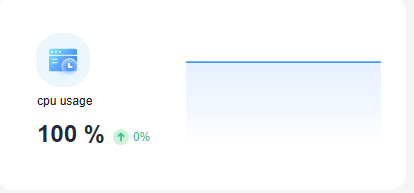
Table 2 Digit graph parameters Parameter
Description
Show Miniature
After this function is enabled, the icon will be zoomed out based on a certain proportion. Also, a line graph is added.
- Top N: The statistical unit is a cluster and statistical objects are resources such as hosts, components, or instances in the cluster. The top N graph displays top N resources in a cluster. By default, top 5 resources are displayed.
To view the top N resources, add a top N graph to the dashboard. You only need to select resources and metrics, for example, host CPU usage. AOM then automatically singles out top N hosts for display. If the number of resources is less than N, actual resources are displayed.
In the following graph, the top 5 hosts with the highest CPU usage are displayed.Figure 3 Top N graph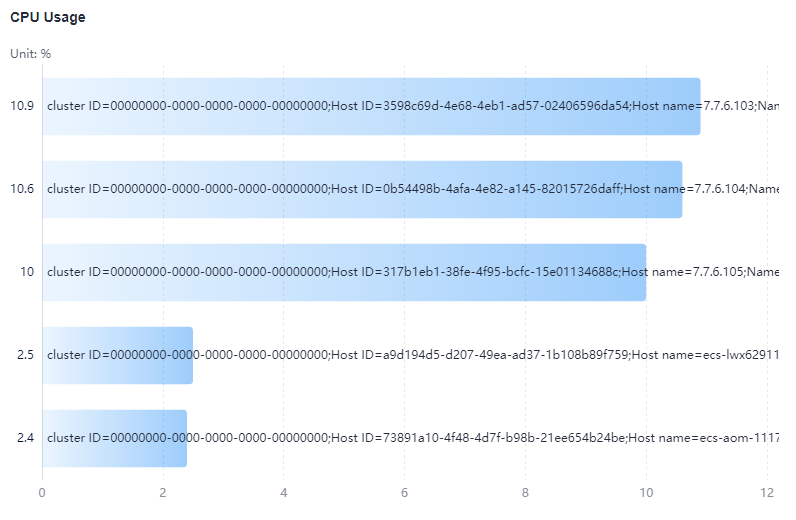
Table 3 Top N graph parameters Category
Parameter
Description
-
Sorting Order
Sorting order of data. Default: Descending.
Upper Limit
The maximum number of resources to be displayed in the top N graph. Default: 5.
Dimension
Metric dimensions to be displayed in the top N graph.
Column Width
Column width. Options: auto (default), 16, 22, 32, 48, and 60.
Unit
Unit of the data to be displayed. Default: %.
Display X-Axis Scale
After this function is enabled, the scale of the X axis is displayed.
Show Value
After this function is enabled, the value on the Y axis is displayed.
Display Y-Axis Line
After this function is enabled, the line on the Y axis is displayed.
Advanced Settings
Left Margin
Distance between the axis and the left boundary of the graph.
Right Margin
Distance between the axis and the right boundary of the graph.
Top Margin
Distance between the axis and the upper boundary of the graph.
Bottom Margin
Distance between the axis and the lower boundary of the graph.
- Table: A table lists content in a systematic, concise, centralized, and comparative manner, and intuitively shows the relationship between different categories or makes comparison, ensuring accurate display of data.
In the following figure, you can view the CPU usage of different hosts in a table.Figure 4 Table
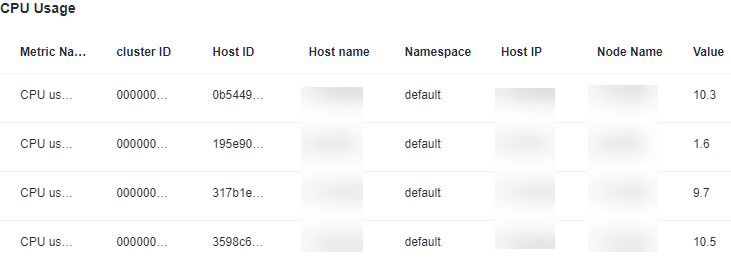
Table 4 Table parameters Parameter
Description
Field Name
Name of a field.
Field Rename
Rename a table header field when necessary.
- Bar graph: A vertical or horizontal bar graph compares values between categories. It shows the data of different categories and counts the number of elements in each category. You can also draw multiple rectangles for the same type of attributes. Grouping and cascading modes are available so that you can analyze data from different dimensions.
In the following figure, you can view the CPU usage of different hosts in a graph.Figure 5 Bar graph
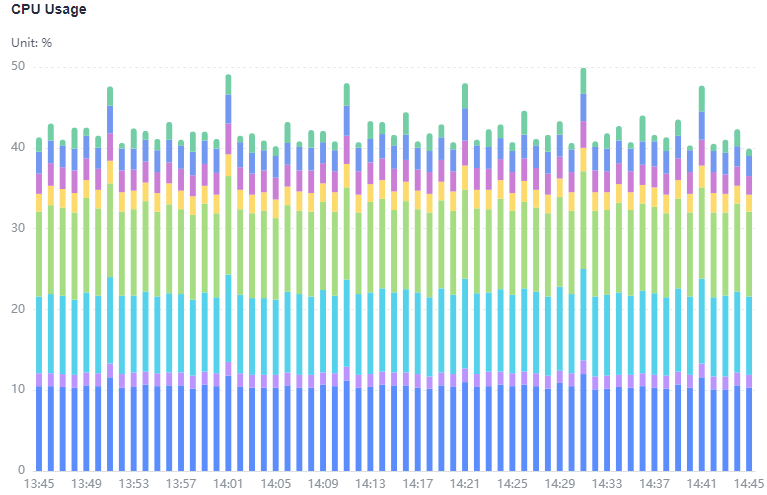
Table 5 Bar graph parameters Category
Parameter
Description
Graphics
Top Margin
Distance between the axis and the upper boundary of the graph.
Bottom Margin
Distance between the axis and the lower boundary of the graph.
Left Margin
Distance between the axis and the left boundary of the graph.
Right Margin
Distance between the axis and the right boundary of the graph.
X Axis
Show
Whether to display the X axis.
X Axis Title
Title of the X axis.
Y Axis
Show
Whether to display the Y axis.
Y Axis Title
Title of the Y axis.
Y Axis Range
Value range of the Y axis.
- Digital line graph: used to analyze the data change trend in a certain period and intuitively display related data. Use this type of graph when you need to monitor the metric data trend of one or more resources within a period.
In the following figure, you can view the CPU usage in different periods in a graph.Figure 6 Digital line graph
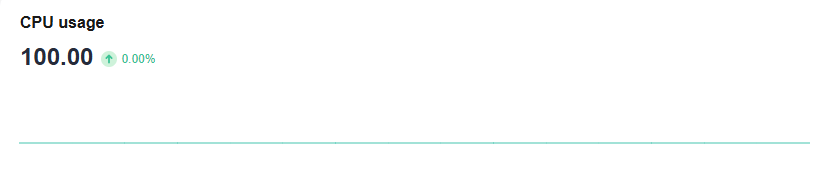
Table 6 Digital line graph parameters Category
Parameter
Description
Chart Mode
Line Shape
Line type. Options: Straight and Curved.
Hide Legend
Whether to hide legends.
Show
Whether to display the X axis.
Show
Whether to display the Y axis.
Show Data Markers
Whether to display the connection points.
Feedback
Was this page helpful?
Provide feedbackThank you very much for your feedback. We will continue working to improve the documentation.See the reply and handling status in My Cloud VOC.
For any further questions, feel free to contact us through the chatbot.
Chatbot


