Help Center/
GeminiDB/
GeminiDB Influx API/
Working with GeminiDB Influx API/
Logs and Audit/
Viewing and Exporting Slow Query Logs
Updated on 2025-10-17 GMT+08:00
Viewing and Exporting Slow Query Logs
You can view slow query logs of GeminiDB Influx databases. Any query that takes longer than an execution time threshold (in milliseconds) will be logged. With slow query logs, you can identify and optimize slow statements.
Usage Notes
- This function is only available for cluster and cluster (performance-enhanced) instances.
- To use this function, choose Service Tickets > Create Service Ticket in the upper right corner of the console and contact the customer service.
Viewing and Exporting Log Details
- Log in to the GeminiDB console.
- On the Instances page, click the target instance name.
- In the navigation pane, choose Slow Query Logs.
- On the Slow Query Logs page, set search criteria and click Search to view log information.
Figure 1 Viewing slow query logs

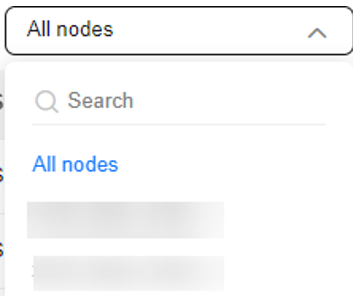
- Select All nodes and view slow query logs of all nodes. Alternatively, select a specific node to view its slow query logs.
Figure 2 Selecting a node
- You can view slow SQL statements of the following types:
- SELECT
- DELETE
- SHOW
- DROP
- CREATE
- ALTER
- After expanding Advanced Search, you can filter logs by:
- Keyword
- Maximum execution time (ms)
- Retention policy
- Database
Figure 3 Advanced search
- On the Log Details page, click
 in the upper right corner of the log list to export log details.
- You can view the exported CSV file on your local PC.
- A maximum of 2000 log details can be exported at a time.
Figure 4 Exporting slow query logs

Feedback
Was this page helpful?
Provide feedbackThank you very much for your feedback. We will continue working to improve the documentation.See the reply and handling status in My Cloud VOC.
The system is busy. Please try again later.
For any further questions, feel free to contact us through the chatbot.
Chatbot


