
Viewing Data Integration Tasks
Overview
After you create a data integration task, you can view the task information, including the task configuration information, run logs, operation logs, and scheduling logs.
You can also modify the task configuration. The procedure for modifying a task is similar to that for creating a task. For details, see Creating a Data Integration Task.

Exercise caution when modifying task configuration information to avoid dirty data or incomplete data integration at the destination. Especially, modifying source or destination information may cause changes to the data integration solution.
Viewing Task Information
- Log in to the ROMA Connect console. On the Instances page, click View Console next to a specific instance.
- In the navigation tree on the left, choose Fast Data Integration > Task Management.
- On the Task Management page, click a task name. On the task details page, view related configuration and log information.
You can filter tasks by Integration Mode, Task Status, Task Name, or other criteria.
Table 1 Task information Content
Description
Task Information
Basic task information, including the task name, task ID, integration mode, and task status.
Task Details
Task configuration information, including the source information, destination information, and mapping information (not available for a combined task).
Schedule
Schedule information of a task. Only scheduled tasks have schedule information. For real-time tasks, no schedule information is involved.
Click Edit to modify the schedule configuration.
Logs
Includes run logs and operation logs of tasks.
- A run log records information about the task execution, including the schedule execution time, data reading time, data volume, and duration of each phase.
- An operation log records the management operations of tasks, including creating, updating, deleting, starting, and stopping tasks.
Viewing Scheduling Details
- Log in to the ROMA Connect console. On the Instances page, click View Console next to a specific instance.
- In the navigation tree on the left, choose Fast Data Integration > Schedule Monitoring.
- On the Schedule Monitoring page, filter information such as the running status, scheduling mode, scheduling period, and latest execution time based on the task status and task name.
For a composite task, you can also view the synchronization progress, time for reading full data in the table, and other information.
- Click View Log on a task to view the detailed scheduling logs of the task.
- You can specify Time Range to view scheduling logs in a specified period.
- You can click
 (detail mode) or
  (list mode) on the right to switch the log display mode.
Figure 1 Scheduling log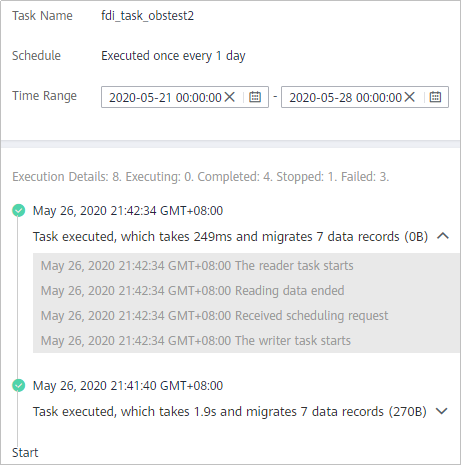
Feedback
Was this page helpful?
Provide feedbackThank you very much for your feedback. We will continue working to improve the documentation.See the reply and handling status in My Cloud VOC.
For any further questions, feel free to contact us through the chatbot.
Chatbot


