Overall Situation Screen
Scenarios
There are always such scenarios as presentation, reporting, or real-time monitoring where you need to present the analysis results of SecMaster on big screens to achieve better demonstration effect. It is not ideal to just zoom in the console. Now, SecMaster Large Screen is a good choice for you to display the service console on bigger screens for a better visual effect.
By default, SecMaster provides a large screen for comprehensive situation awareness by displaying the attack history, attack status, and attack trend. This allows you to manage security incidents before, when, and after they happen.
Prerequisites
You have enabled Large Screen. For details, see Buying Value-Added Packages.
Viewing the Overall Situation Screen
- Log in to the SecMaster console.
- Click
 in the upper left corner of the management console and select a region or project.
 - In the navigation pane on the left, choose Workspaces > Management. In the workspace list, click the name of the target workspace. Figure 1 Workspace management page

- In the navigation pane on the left, choose Situation Awareness > Large Screen. Figure 2 Large Screen

- Click Play in the lower right corner of the overall situation image to access the screen.
This screen includes many graphs. More details are provided below.
Security Score
The security score of the current assets is displayed, as shown in Figure 3.
| Parameter | Statistical Period | Update Frequency | Description |
|---|---|---|---|
| Security Score | Real-time |
| The score is calculated based on security services you use, and the levels and numbers of unhandled configuration issues, vulnerabilities, and threats. Each calculation item is assigned a weight.
|
Alert Statistics
The alert statistics of interconnected services are displayed, as shown in Figure 4.
The alert data comes from the page in the current workspace. You can view more details on this page.
| Parameter | Statistical Period | Update Frequency | Description |
|---|---|---|---|
| New Alerts | Today | 5 minutes | Number of new alerts generated on the current day. |
| Alerts | Last 7 days | 5 minutes | Number of new alerts generated in the last seven days. |
| Unhandled Alerts | Last 7 days | 5 minutes | Number of alerts that have not been cleared in the last seven days. |
| Handled Alerts | Last 7 days | 5 minutes | Number of alerts that have been cleared in the last seven days. |
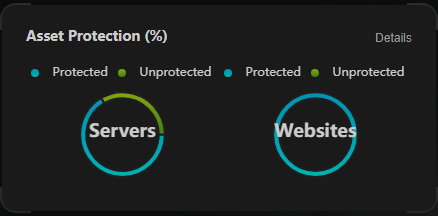
Asset Protection
The protection status of servers and websites is displayed, including the proportion of protected and unprotected assets, as shown in Figure 5. You can hover the cursor over a module to view the number of protected/unprotected assets.
| Parameter | Statistical Period | Update Frequency | Description |
|---|---|---|---|
| Asset Protection (%) | Last 7 days | 5 minutes | The protection status of servers and websites is displayed, including the proportion of protected and unprotected assets.
|
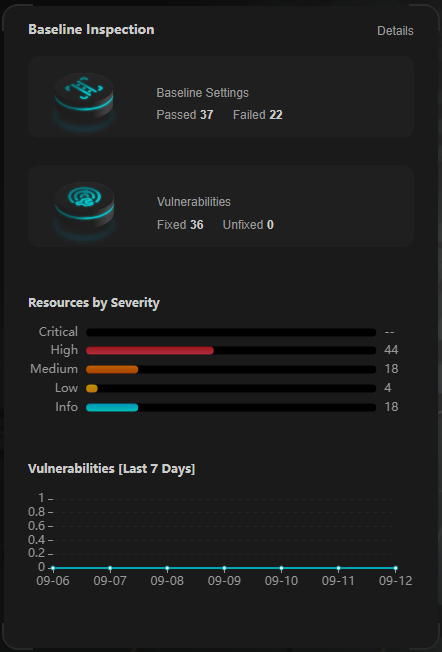
Baseline Inspection
The fixing status of the baseline configuration and vulnerabilities of your assets, distribution of risky resources, and vulnerability fixing trend within seven days are displayed, as shown in Figure 6.
- The baseline data comes from the page in the current workspace. You can view more details on this page.
- The vulnerability data comes from the page in the current workspace. You can view more details on this page.
| Parameter | Statistical Period | Update Frequency | Description |
|---|---|---|---|
| Baseline Settings | Real-time | 5 minutes | Numbers of baseline settings that passed and failed the last baseline inspection. |
| Vulnerabilities | Last 7 days | 5 minutes | Numbers of fixed and unfixed vulnerabilities in the last seven days. |
| Resources by Severity | Real-time | 5 minutes | Numbers of unsafe resources at different severities in the last baseline inspection. Severity: Critical, High, Medium, Low, and Info. |
| Vulnerabilities | Last 7 days | 5 minutes | New vulnerabilities by the day for the last seven days and vulnerability distribution. |
Recent Threats
The number of threatened assets and the number of security logs reported every day in the last seven days are displayed, as shown in Figure 7.
The x-axis indicates the time, the y-axis on the left indicates the number of threatened assets, and the y-axis on the right indicates the number of logs. Hover the cursor over a date to view the number of threatened assets of that day.
| Parameter | Statistical Period | Update Frequency | Description |
|---|---|---|---|
| Attacks | Last 7 days | 5 minutes | Number of daily alerts over the last seven days. The alert data comes from the page in the current workspace. You can view more details on this page. |
| Logs | Last 7 days | 5 minutes | Number of security logs reported every day in the last seven days. |
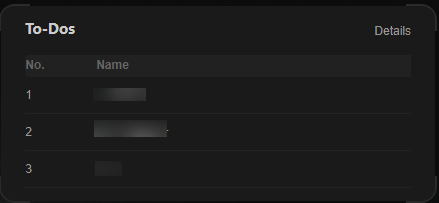
To-Dos
The to-do items in the current workspace are displayed, as shown in Figure 8.
| Parameter | Statistical Period | Update Frequency | Description |
|---|---|---|---|
| To-Dos | Real-time | 5 minutes | To-do items on the in the current workspace. |
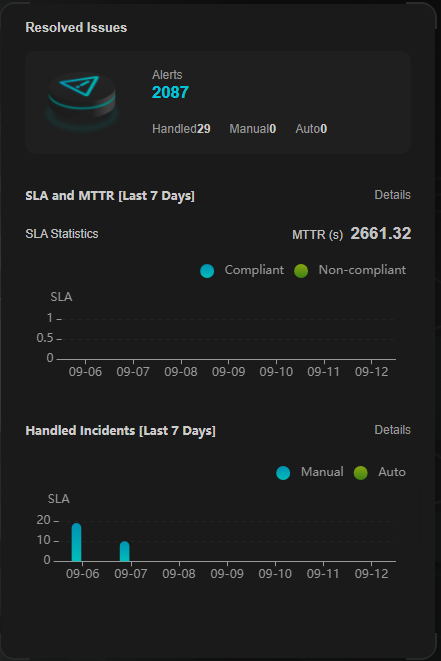
Resolved Issues
The alert handling status, SLA and MTTR fulfillment rate over the last seven days, and automatic incident handling statistics over the last seven days are displayed, as shown in Figure 9.
The alert data comes from the page in the current workspace. You can view more details on this page.
| Parameter | Statistical Period | Update Frequency | Description | |
|---|---|---|---|---|
| Alerts | Alerts | Last 7 days | 5 minutes | Number of new alerts generated in the last seven days. |
| Handled | Number of alerts that have been cleared in the last seven days. | |||
| Manual | Number of alerts that were handled within the SLA time in the last seven days. Alerts handled as planned and earlier than planned are counted. | |||
| Auto | Number of alerts that were automatically handled by SecMaster playbooks over the past seven days. To determine how an alert was handled, check whether the value of close_comment is ClosedByCSB or ClosedBySecMaster in the alert details. If it is, the alert was automatically handled. If it is not, the alert was manually handled. | |||
| SLA and MTTR [Last 7 Days] | SLA Statistics | Last 7 days | 5 minutes | Alert handling timeliness in the last seven days. The formula is as follows: For an alert with Service-Level Agreement (SLA) specified, if Alert closure time - Alert generation time ≤ SLA, it indicates the alert was handled in a timely manner. Otherwise, the alert fails to meet SLA requirements.
|
| MTTR | Average alert closure time in the last seven days. The formula is as follows: Mean Time To Repair (MTTR) = Total processing time of each alert/Total number of alerts. Processing time of each alert = Closure time – Creation time. | |||
| Handled Alerts [Last 7 Days] | Last 7 days | 5 minutes | Total number of alerts handled in the last seven days.
To determine how an alert was handled, check whether the value of close_comment is ClosedByCSB or ClosedBySecMaster in the alert details. If it is, the alert was automatically handled. If it is not, the alert was manually handled. | |
Feedback
Was this page helpful?
Provide feedbackThank you very much for your feedback. We will continue working to improve the documentation.See the reply and handling status in My Cloud VOC.
For any further questions, feel free to contact us through the chatbot.
Chatbot


