
Updated on 2025-05-08 GMT+08:00
Debugging a Task Flow Online
After creating and configuring a composite application and its task flows, you can debug the flows online and view the running information of each node in real time to meet service requirements.
Prerequisites and Constraints
- A ROMA Connect instance is required to serve as the debugging environment. You can purchase an exclusive ROMA Connect instance or use a shared instance.
- Online flow debugging may affect other flows running on the instance. You are advised to use an exclusive instance for debugging.
- A shared instance allows only one flow to be debugged at a time. An exclusive instance allows a maximum of five flows to be debugged at a time.
- The trigger node does not run during online debugging. For example, the OpenAPI node does not publish any API during debugging. Manually configure the trigger node to trigger the flow.
- The debugging process pauses at a node for a maximum of 60 seconds, and then proceeds to the next one.
Procedure
- Log in to the new ROMA Connect console.
- In the navigation pane on the left, choose Application. On the page displayed, click the target application.
- Click Modify in the upper right to go to the design page.
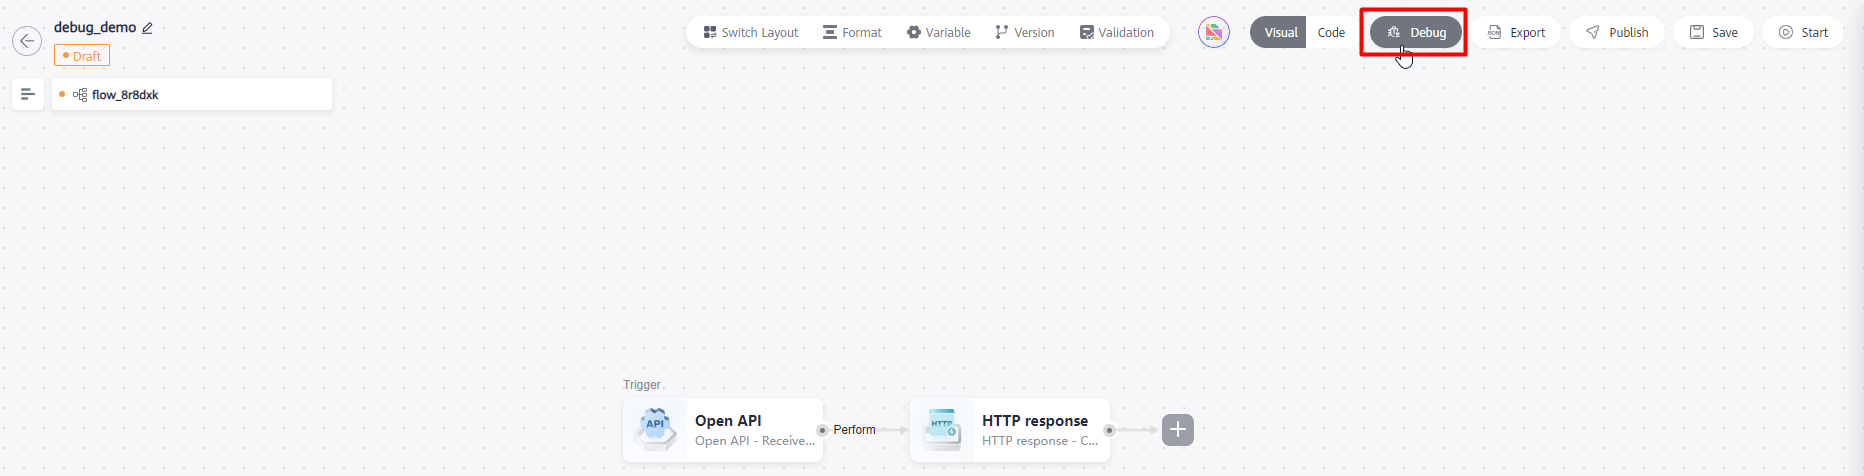
- Click Debug at the top to enter the debugging mode.
Figure 1 Canvas for application designing
- Select a debug environment. Set Region, Project, and Instance for the online debugging environment.
Figure 2 Configuring debugging environment
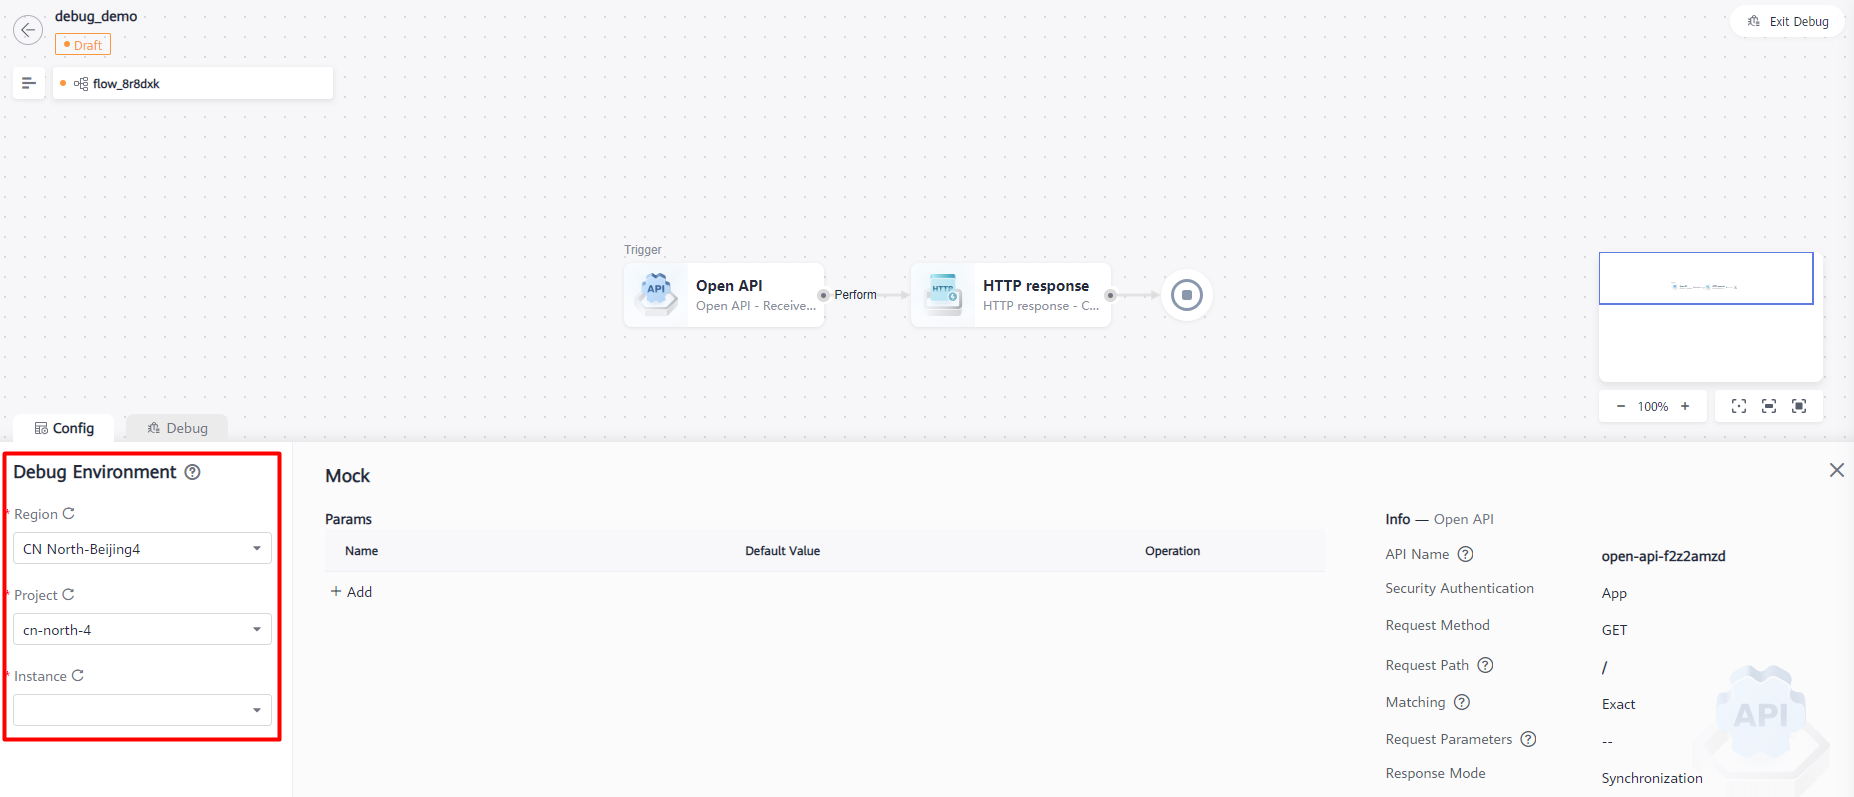
- Configure the trigger node. Configure trigger parameters based on the trigger type. For example, configure API request parameters and request body for an OpenAPI node.
Figure 3 Configuring OpenAPI node parameters

- Click Save.
- Debug the flow.
Figure 4 Debugging a flow
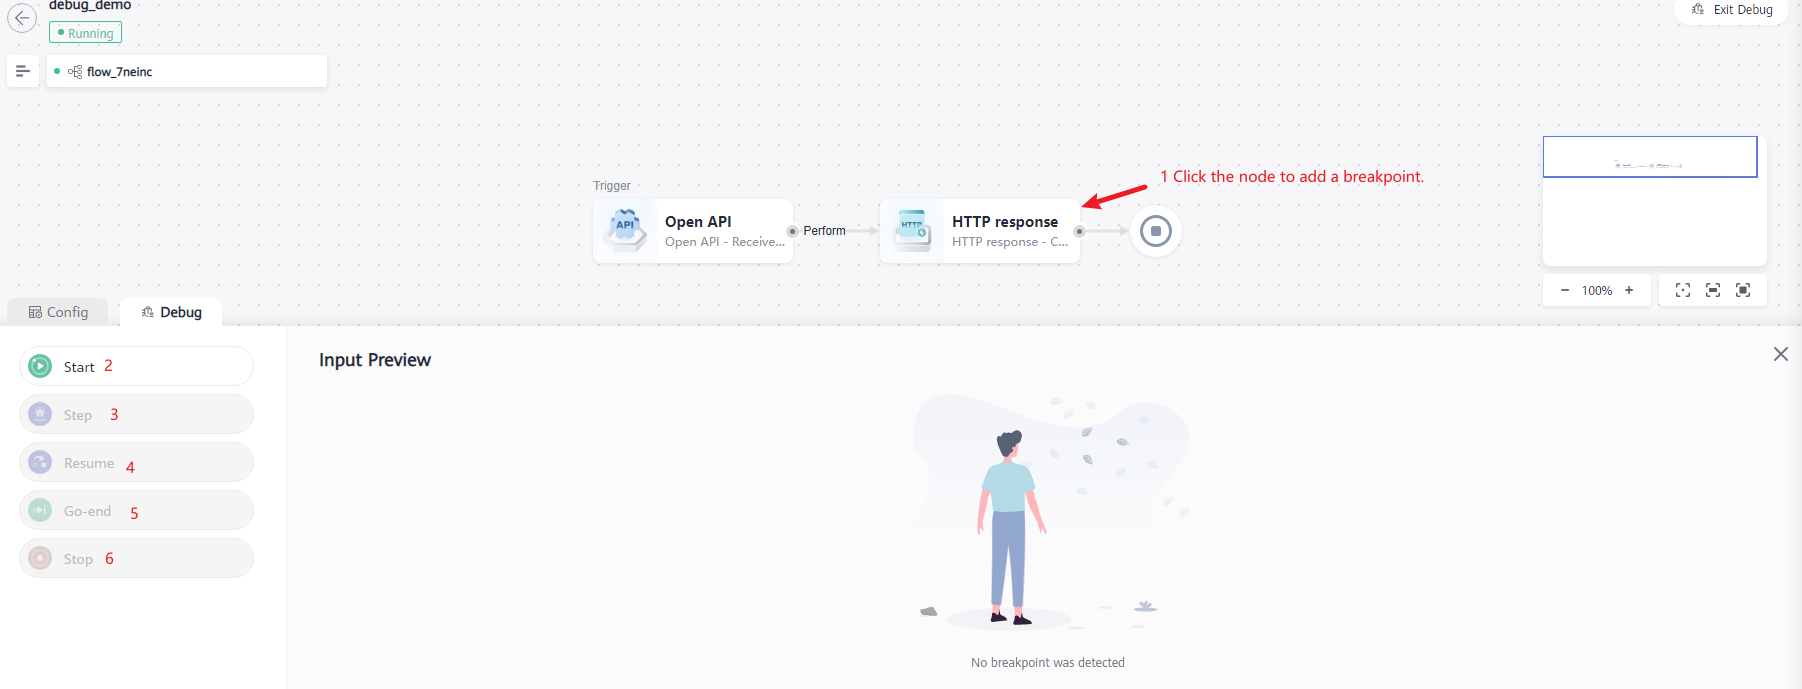
- Click a node of the flow to add a breakpoint. The flow may stop at a breakpoint during debugging. To remove the breakpoint, click the node again.
Breakpoints cannot be added to trigger, parallel processor, or conditioning nodes.
- Start: Click Start to start debugging a flow. If a breakpoint exists in the flow, the task stops at the breakpoint and the properties and payload data that enters the breakpoint is displayed. In other cases, the task automatically runs through the flow, or stops at the error node with the error information.
- Step: When the debugging process pauses at a node, click Step to proceed to the next node.
- Resume: When the debugging process pauses at a node, click Resume to proceed to the next breakpoint. If no such breakpoint exists, the task automatically runs through the flow, or stops at the error node with the error information.
- Go-end: When the debugging process pauses at a node, click Go-end to run through the flow, or the task stops at the error node with the error information.
- Stop: When a flow is in the debugging state, click Stop to terminate the debugging.
- Click a node of the flow to add a breakpoint. The flow may stop at a breakpoint during debugging. To remove the breakpoint, click the node again.
- After the debugging is complete, click Exit Debug in the upper right to exit the debugging mode and return to the application design page.
Feedback
Was this page helpful?
Provide feedbackThank you very much for your feedback. We will continue working to improve the documentation.See the reply and handling status in My Cloud VOC.
The system is busy. Please try again later.
For any further questions, feel free to contact us through the chatbot.
Chatbot


