
Customizing Extensions on the GUI
You can create, configure, and manage extensions on the GUI.
Notes and Constraints
- Version of the extension should be in X.X.X format. Each digit ranges from 0 to 99.
- Information on the Version Info page cannot be modified later.
Creating an Extension
- Access the CodeArts Pipeline homepage.
- On the CodeArts Pipeline homepage, choose Services > Extensions.
- Click
 .
. - Set basic information. For details, see Table 1.
Table 1 Extension information Parameter
Description
Icon
Icon of the extension. Upload an image in PNG, JPEG, or JPG format, with a file size no more than 512 KB (recommended: 128 x 128 pixels). If no image is uploaded, the system generates an icon.
Name
The extension name displayed in the extension platform. Enter only spaces, letters, digits, underscores (_), hyphens (-), and periods (.) with a maximum of 50 characters.
Unique Identifier
ID of the extension. Once set, this parameter cannot be changed. Enter only letters, digits, underscores (_), and hyphens (-) with a maximum of 50 characters.
Type
Type of the extension, which can be Build, Check, Test, Deploy, or Normal. Once set, this parameter cannot be changed.
Description
Purposes and functions of the extension. The description can be edited. Enter no more than 1,000 characters.
- Click Next. On the Version Information page, set the version and description.
- Click Next. The Input page is displayed. Configure widgets as needed.
You can drag and drop widgets to generate visual forms and to streamline pipeline contexts. Multiple preset widgets are available: Single-line Text Box, Digit, Single-selection Drop-down List, Multi-selection Drop-down List, Option Button, Switch, Multi-line Text Box, and so on.
Figure 1 Orchestrating widgets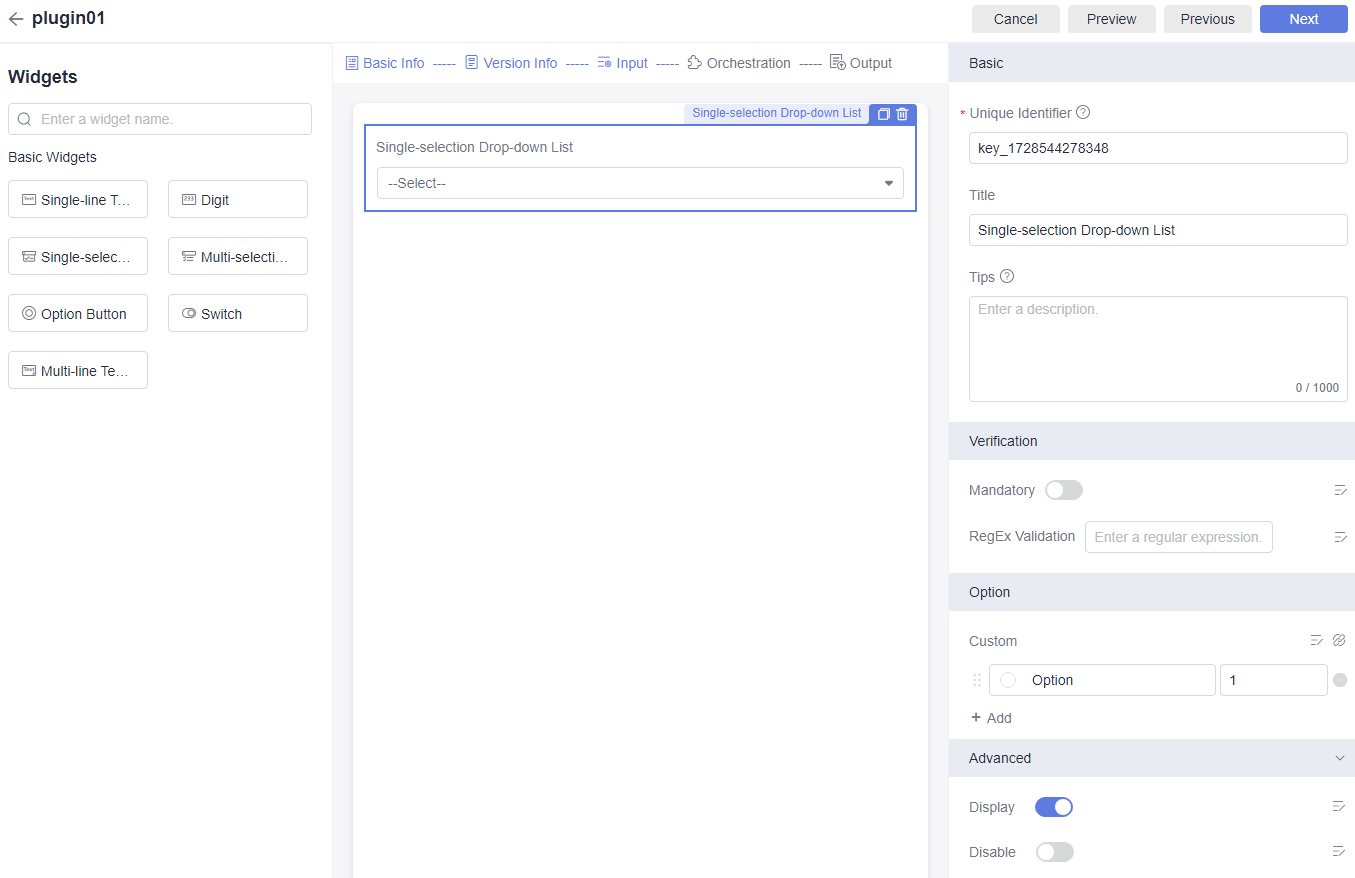
Drag required widgets to the middle area. Click a widget and configure its parameters on the right part of the page.
Table 2 Widget parameters Category
Parameter
Description
Widget
Basic
Unique Identifier
Unique ID of the widget. The ID is used to obtain widget input. Enter only letters, digits, underscores (_), and hyphens (-) with a maximum of 200 characters.
All
Title
Name of the widget. The name will be displayed on the pipeline job orchestration page. Enter no more than 140 characters.
All
Tips
Tooltip of the widget. Enter no more than 1,000 characters.
All
Placeholder
Informative message displayed in the text box. For example, what value should be input.
Single-line Text Box
Accuracy
Number of decimal places allowed in a widget value: 0 to 4.
Digits
Default Value
Default value of the widget.
Single-line Text Box, Digit, Switch, Multi-line Text Box, and Metrics
Verification
Mandatory
Whether the widget content is mandatory. Error messages can be set.
Single-line Text Box, Digit, Single-selection Drop-down List, Multi-selection Drop-down List, Option Button, and Multi-line Text Box
RegEx Validation
Verifies the widget content. You can set error messages.
Single-line Text Box, Digit, Single-selection Drop-down List, Multi-selection Drop-down List, and Multi-line Text Box
Word limit
Max. widget characters.
Multi-line Text Box
Option
Custom
Options available for the widget. Click
 to add an option. Click
  to delete an option.
- Option name: option displayed on the extension configuration page.
- Value: value delivered when the extension is running.
In addition to manual configuration, set options by:
- APIs: Set options by configuring web APIs. Click
 on the right. On the displayed dialog box, you can configure parameters after enabling the function. For details, see Table 3.
 - Context: Configure data source to obtain the URL of the pipeline source or IDs of build jobs. Click
 next to Custom. The context dialog box is displayed. You can configure parameters after enabling the function.
Single-selection Drop-down List, Multi-selection Drop-down List, and Option Button
Advanced
Display
Whether the widget is visible. You can click
 on the right to set display conditions.
All
Disable
Whether the widget is disabled (not disabled by default). You can click
 on the right to set conditions.
All
Table 3 API parameters Parameter
Description
Enabled
By enabling the function, you can set options by configuring APIs.
Linked Attribute
Associates the selected widgets with the API to transfer parameters. When a widget value is changed, the new value is used to call the API again.
URL
Only HTTPS protocol is supported.
Returned Data Path
The widget used must be list data. In the following response body example, the returned data path is result.parameters.
{
    "result": {
        "total": 2,
        "parameters": [
            {
                "id": 3353753,
                "name": "parameters01"
            },
            {
                "id": 3353697,
                "name": "parameters02"
            }
        ]
    },
    "status": "success"
}
Option Value
Set this parameter to the value of the corresponding field in the returned data path. This parameter is delivered when the extension is running.
Option Name
Set this parameter to the value of the corresponding field in the returned data path. This parameter is displayed on the extension configuration page.
Params
Params parameters of the API request body.
Header
Header parameters of the API request body.
Remote Search
Enable this function to add a remote search field. For extension search, the entered value will be used as the value of the remote search field to call the API again.
- Params parameter: The parameter type of the search field is the Params parameters of the API request body.
- Body parameter: The parameter type of the search field is the Body parameters of the API request body.
Search Tip
Describes the search function and is displayed below the search bar. Max. 100 characters.
- Click Next. On the displayed Orchestration page, you can add the ExecuteShellCommand extension.
- ExecuteShellCommand: executes shell commands entered by users.
Enter shell commands. Commands will be executed when a pipeline calls the extension. The commands indicate the actual service logic implementation process of an extension. For more input and output configurations, see Customizing Shell Commands.
- ExecuteShellCommand: executes shell commands entered by users.
- Click Next. On the Output page, click Add Configuration to configure output information, including output, link, table, and metric. After the pipeline is executed, go to the job result page to check the extension execution results. The result information is displayed by result type.
- output: displayed on the Others card. It outputs data together with shell commands.
- metric: displayed on the Others card. It outputs metric thresholds. The thresholds information can be referenced in an extension and finally applied to pipelines.
- link: displayed on the Link card. You can click the link to go to the corresponding page.
- table: displayed on the Tabular Data page. It is an object array and displays the array information in a table.
- After the configuration, click Release or Release Draft.
- Draft release
Click Release Draft to release a test version.
- You can configure a draft extension in a pipeline for debugging. After debugging, the draft extension can be officially released, so that other members of the current tenant can use the extension.
- All draft versions are marked with Draft.
- Only one draft is allowed. If there is already a draft, no more versions can be created until you officially release or delete the draft.
- Official release
Click Release to release an official version. An official extension has a unique version number. All members of the current tenant can use this version in a pipeline.
- Draft release
Customizing Shell Commands
When registering an extension or creating an extension version, you can use shell commands to implement service logic. The commands usually involve interaction with all kinds of data during pipeline execution. This section describes how to implement extension logic through data input and output.
- Data Input
The obtained data consists of low-code GUI input, pipeline run parameters, and other information.
- Low-code GUI input: Obtain the low-code user interface output using environment variables, for example, echo ${Widget ID}.
- Pipeline run parameters: Some pipeline run parameters will be delivered to environment variables, as shown in the following table.
Table 4 Pipeline environment variables Variable
Description
STEP_NAME
Step name of the pipeline.
STEP_ID
Step ID of the pipeline.
PLUGIN_VERSION
Version of the extension.
PIPELINE_ID
Pipeline ID.
PIPELINE_RUN_ID
Pipeline execution ID.
PLUGIN_NAME
Extension name.
PROJECT_ID
Project ID.
JOB_ID
Job ID of the pipeline.
RESULT_MSG_PATH
Directory for storing the file of extension execution result. The ${STEP_ID}_result.json and ${STEP_ID}_metrics.json files are written to this directory to report the execution result to the pipeline.
- Other information: Obtain information by interacting with external data through Git, Wget, and Curl.
- Data Output
Once executed, the custom extension can read file information in a specified path and obtain the metric data output.
- On the configuration page, configure the thresholds output of the extension.
- During development, the ${STEP_ID}_result.json and ${STEP_ID}_metrics.json files are stored in a specified path so that metric values can be parsed.
Table 5 Output files File
Description
${RESULT_MSG_PATH}/${STEP_ID}_result.json
The output is a text file in {"par1":123, "par2":456} format. After the pipeline is executed, the result will be displayed as the corresponding task result. Only extensions of the check type can display the result.
${RESULT_MSG_PATH}/${STEP_ID}_metrics.json
The output is a text file in {"par1":123, "par2":456} format. The Metrics widget should be configured. After the extension is executed, the threshold configured for the Metrics widget and the content of ${STEP_ID}_metrics.json are parsed for pipeline pass conditions. Notes:
- During parsing, empty key values in the Metrics widget will be ignored.
- If the key value configured for the Metrics widget cannot be found in the ${STEP_ID}_result.json file, the specified threshold value will be used.
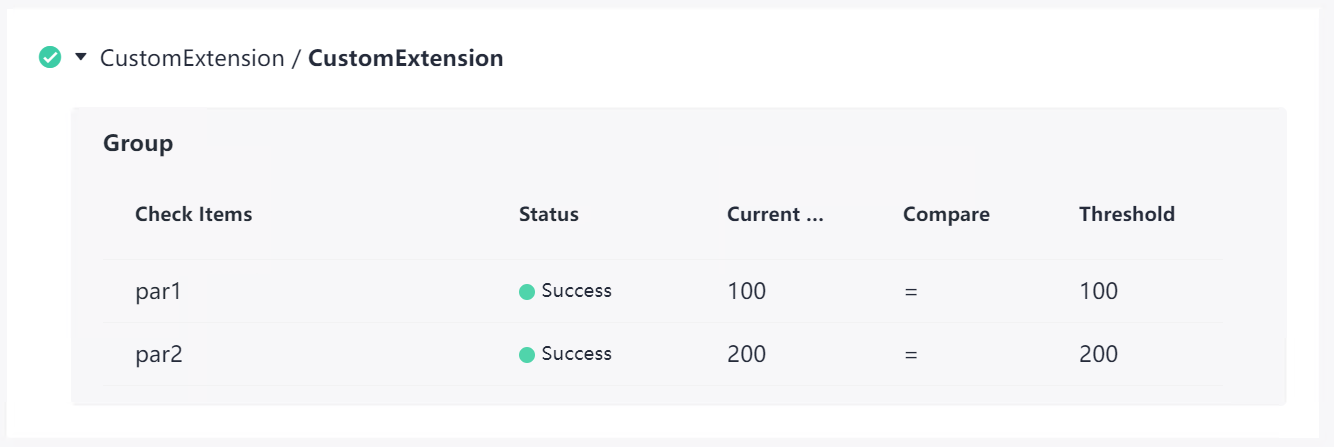
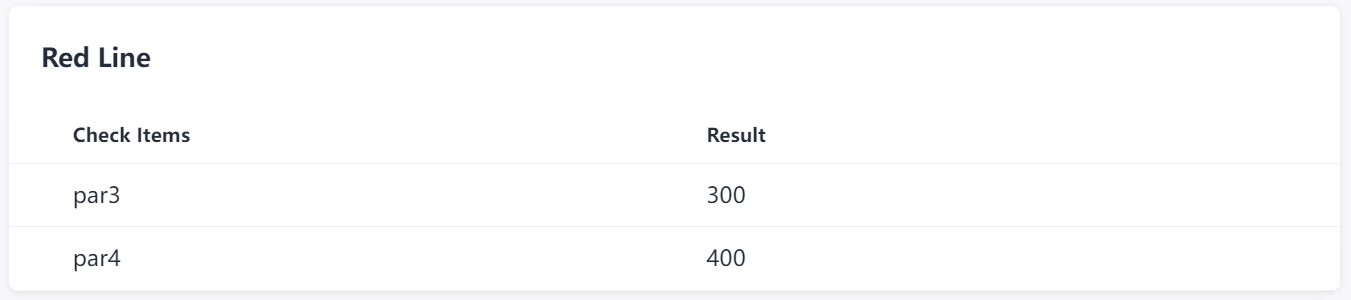
Example: par1 and par2 for task result display; par3 and par4 for pass conditions. The sample code is as follows:
# Optionally, construct the extension output. echo '{"par1":100,"par2":200}' > ${RESULT_MSG_PATH}/${STEP_ID}_result.json echo '{"par3":300,"par4":400}' > ${RESULT_MSG_PATH}/${STEP_ID}_metrics.json - After the extension run is complete, click the extension card to view the output.
If policies are configured for the current extension and applied to the pipeline pass conditions, click the pass conditions to check the check status.
Feedback
Was this page helpful?
Provide feedbackThank you very much for your feedback. We will continue working to improve the documentation.See the reply and handling status in My Cloud VOC.
For any further questions, feel free to contact us through the chatbot.
Chatbot


