Overview
You can use dashboards to view core metrics and compare the performance data of different services.
If the default dashboard does not meet your needs, you can create a custom dashboard, add monitoring graphs, and view custom data. You can also edit or delete graphs on the dashboard.
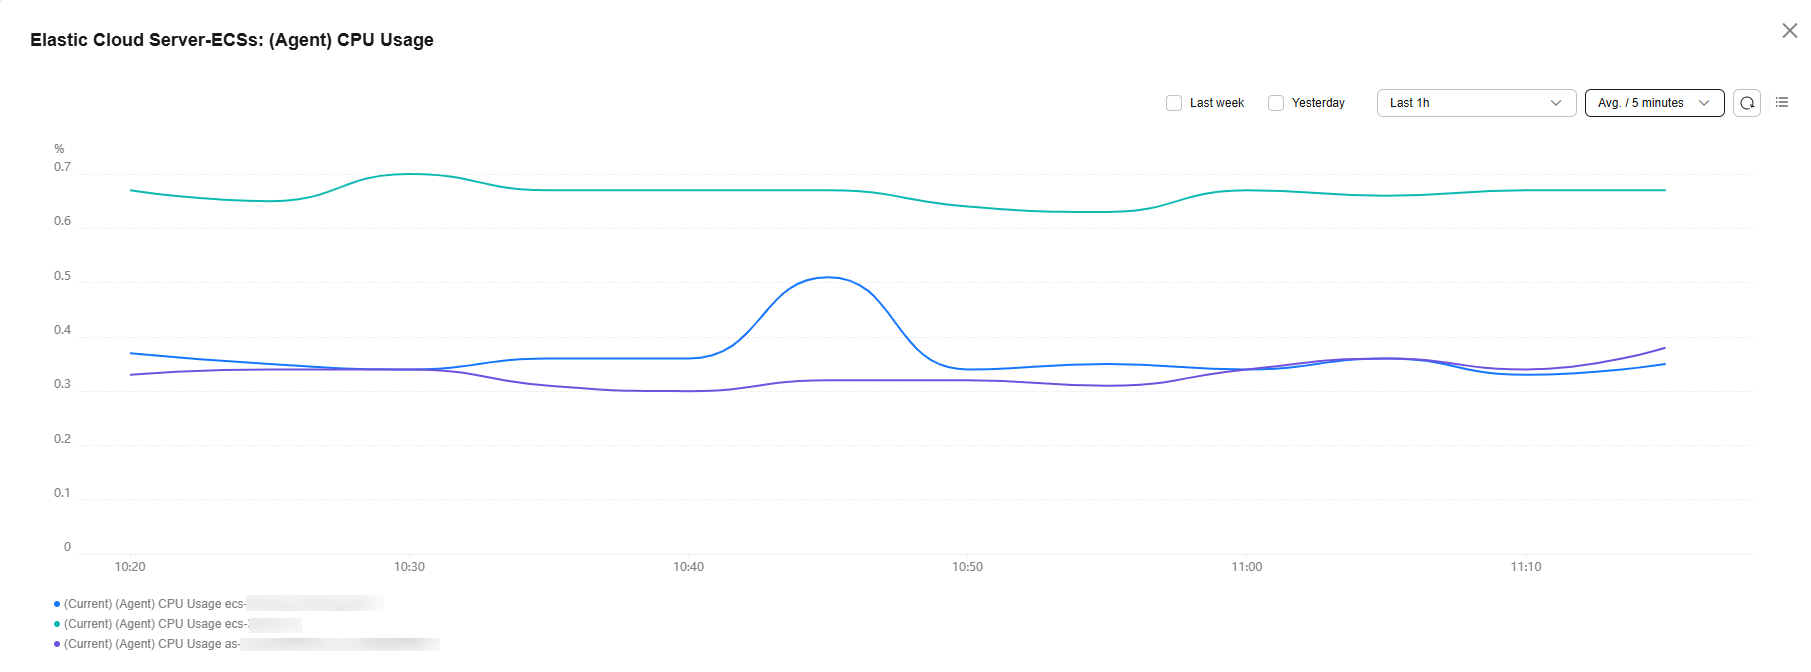
Monitoring Data Trends of Multiple Instances
For example, if an application is deployed on multiple ECSs, you can add the monitoring details of these ECSs to the same graph to view their monitoring data changes. For example, you can view the CPU usage trends for multiple ECSs in one graph.

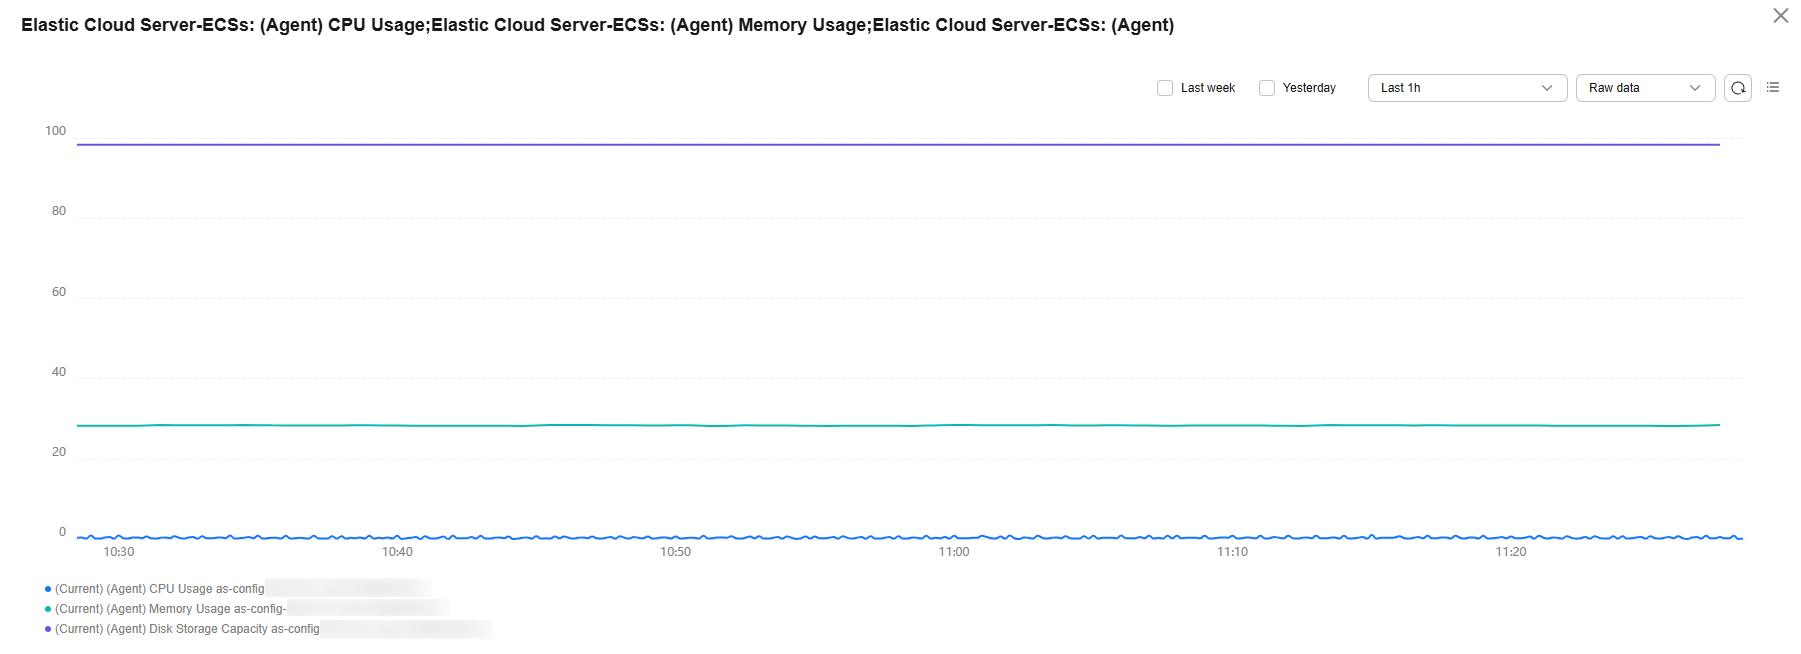
Comparing Multiple Metrics
You can view multiple metrics, like the CPU usage, memory usage, and disk usage of an ECS in one graph.

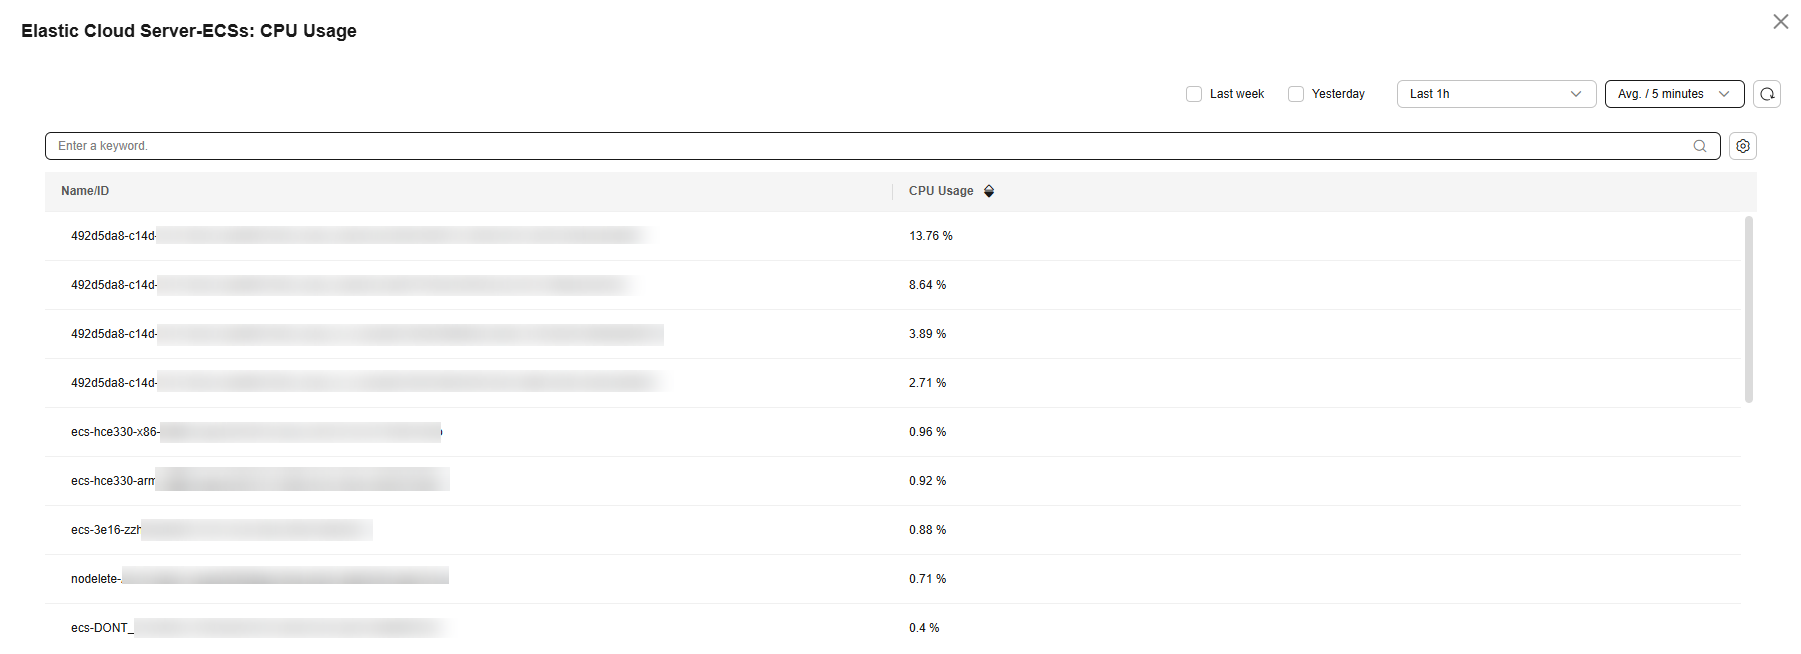
Viewing Resource Consumption
If you have 20 ECSs, their CPU usage will be listed from highest to lowest. You can track your resource usage easily and optimize them to cut down expenses.

Viewing in Full Screen
The custom dashboards can be displayed in full screen and automatically refreshed. You can add various product metrics to a dashboard and display them on the full screen.

Feedback
Was this page helpful?
Provide feedbackThank you very much for your feedback. We will continue working to improve the documentation.See the reply and handling status in My Cloud VOC.
For any further questions, feel free to contact us through the chatbot.
Chatbot


