
How Are Collection Node or Collection Channel Faults Handled?
Symptoms
The component controller isap-agent periodically reports the collection node status and collection channel health status. Despite a delay of about one minute, the Health Status of a collection node or collection channel was still displayed as Faulty 3 minutes after the collection channel is delivered, and the CPU usage or memory usage of the server is about to reach 100%.
Possible Causes
The configured connector or parser has syntax or semantic errors. As a result, the collector cannot run properly and restarts over and over again. The CPU and memory are exhausted.
Fault Location
- Remotely log in to the ECS where the collection node resides.
- Run the following command to check the OS running status:
If the following information is displayed, the Java process in the ECS uses a large number of CPU resources.
Figure 3 Status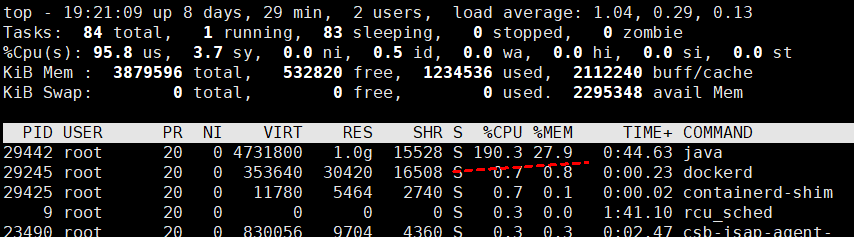
- Run the following command to view the collector run logs:
According to the logs, the filter (parser) configuration of the current collection channel is incorrect, as shown in the following figure.
Figure 4 Collector run log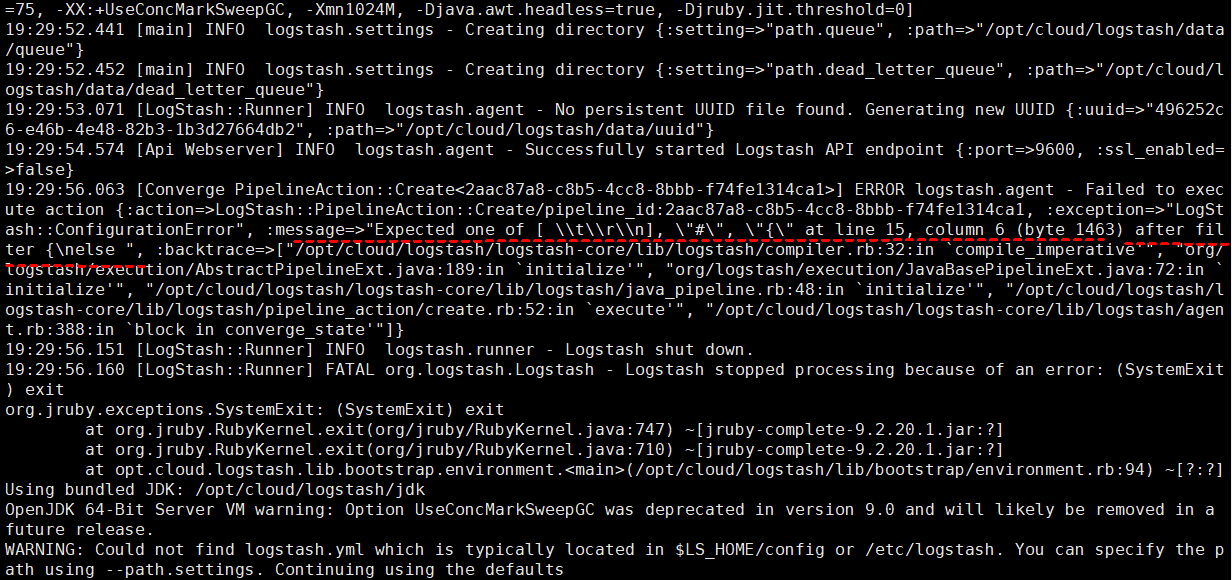
- Run the following command to switch to the directory where the collection channel configuration file is stored:
- Run the following command to check whether the filter part is abnormal:
If the information shown in the following figure is displayed, the current filter is abnormal.
Figure 5 Filter exceptions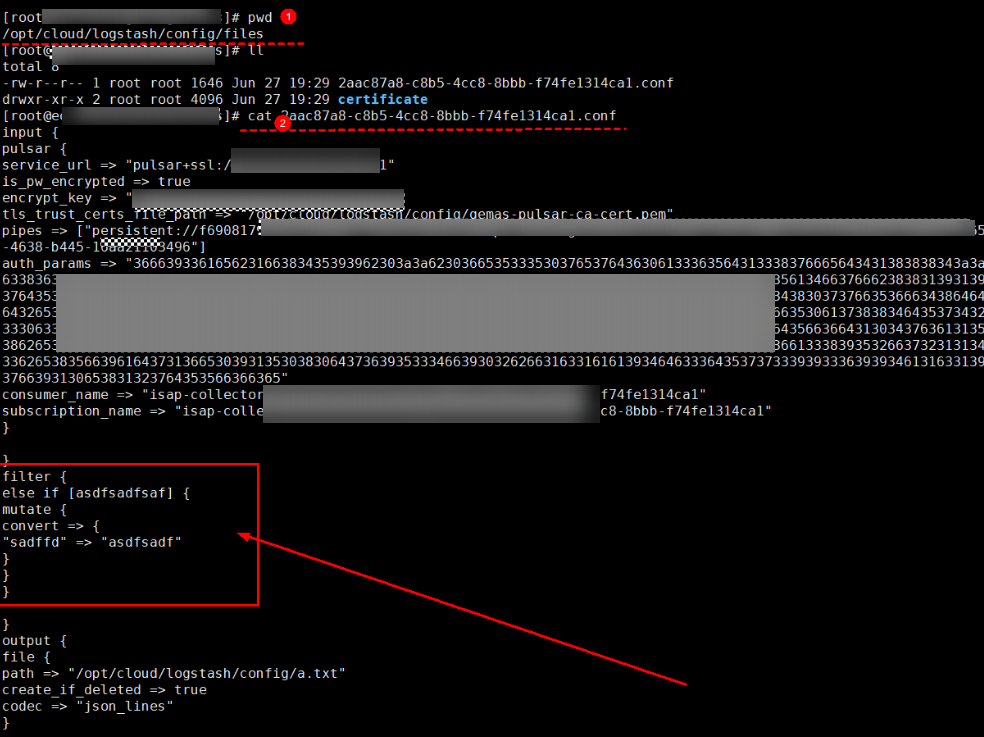
Solution
- Log in to the SecMaster console and access the target workspace.
- In the navigation pane on the left, choose . Then, select the Parsers tab.
- Click Edit in the Operation column of the row containing the target parser. On the edit page, delete the incorrect configuration and configure it again.
Figure 6 Configurations of an abnormal parser
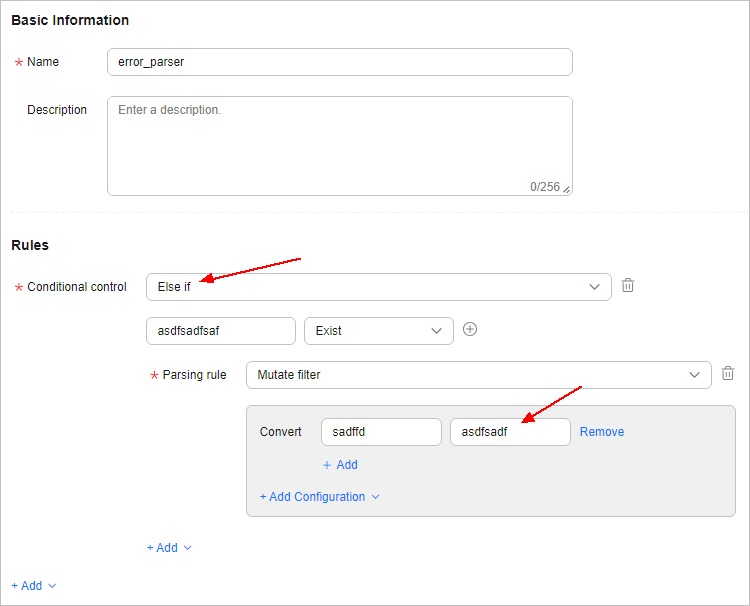 Figure 7 Modifying the parser configuration
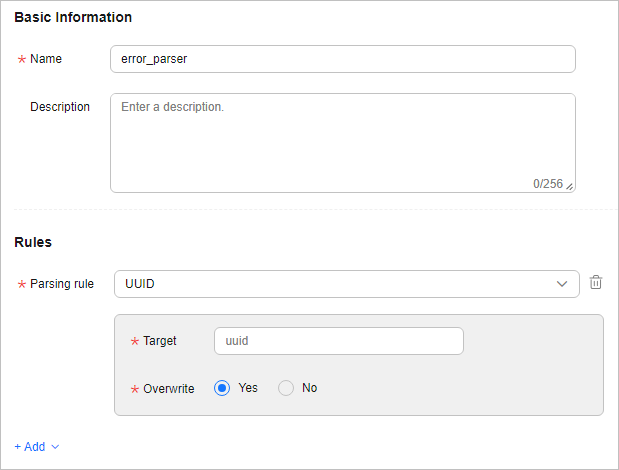
- Click OK.
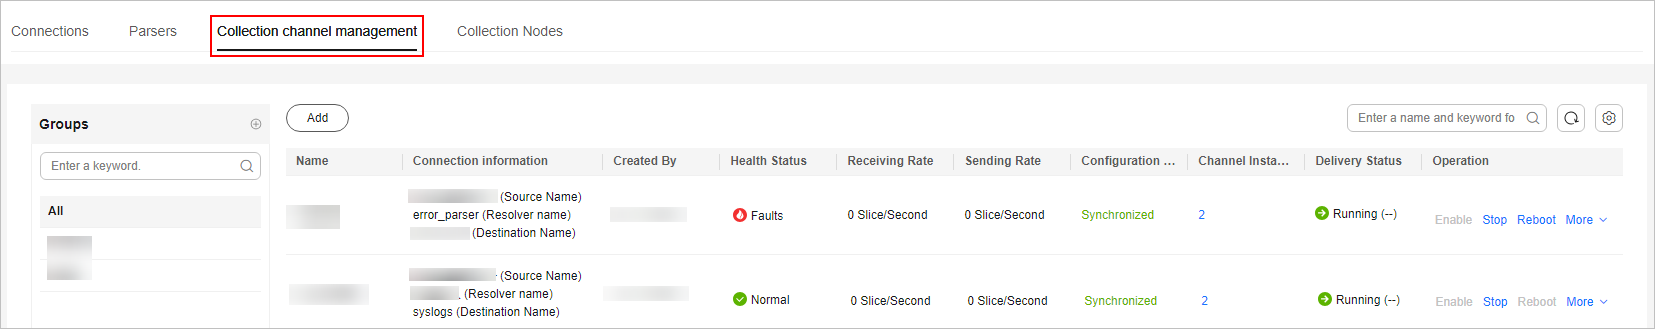
- Click the Collection Channels tab, locate the target connection channel, and click Restart in the Operation column.
- Check the status of the collection channel and collection node.
- After the restart is complete, go to the Collection Channels tab and check the health status of the target collection channel.
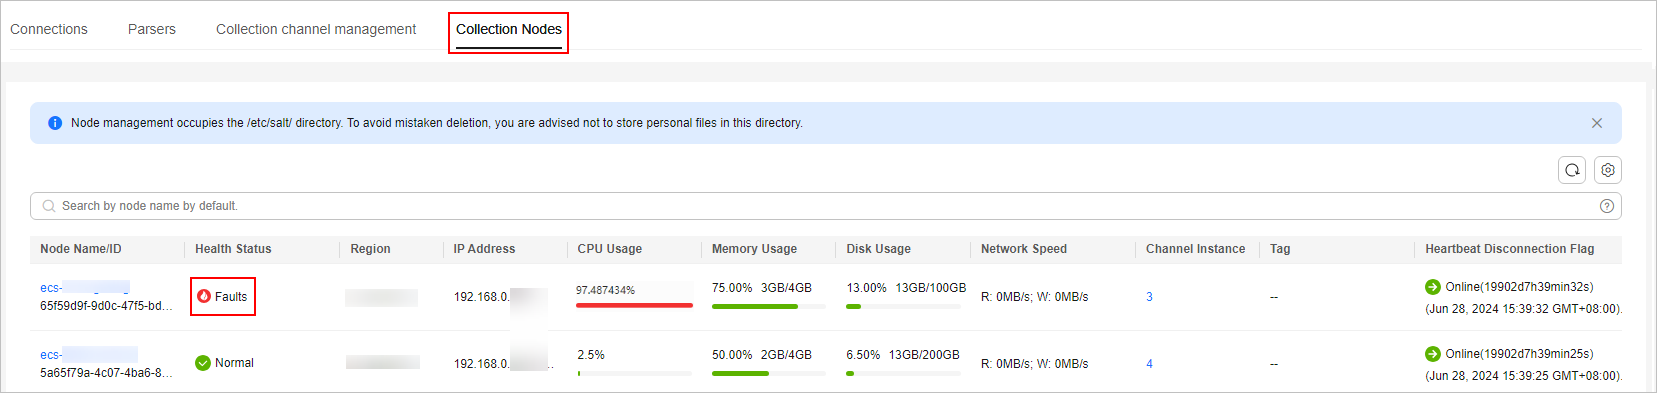
- Select the Collection Nodes tab. On the page displayed, check the health status of the target collection node.
If the Health Status of the collection channel and collection node is Normal, the fault has been rectified.
Feedback
Was this page helpful?
Provide feedbackThank you very much for your feedback. We will continue working to improve the documentation.See the reply and handling status in My Cloud VOC.
For any further questions, feel free to contact us through the chatbot.
Chatbot


