Example for Using PoWA
PoWA can collect and display various performance metrics. This example describes how to view a slow SQL statement.
- Log in to the management console.
- Click
 in the upper left corner and select a region.
 - Click
 in the upper left corner of the page and choose Databases > Relational Database Service.
 - On the Instances page, locate the target DB instance and click Log In in the Operation column.
Alternatively, click the instance name on the Instances page. On the displayed Basic Information page, click Log In in the upper right corner of the page.
- On the displayed login page, enter the correct username and password and click Log In.
- In the database list of the Home page, click Create Database.
- On the displayed page, enter a database name test and select a character set.
- Choose SQL Operations > SQL Query to execute a slow SQL statement, for example, SELECT pg_sleep($1), in the test database.
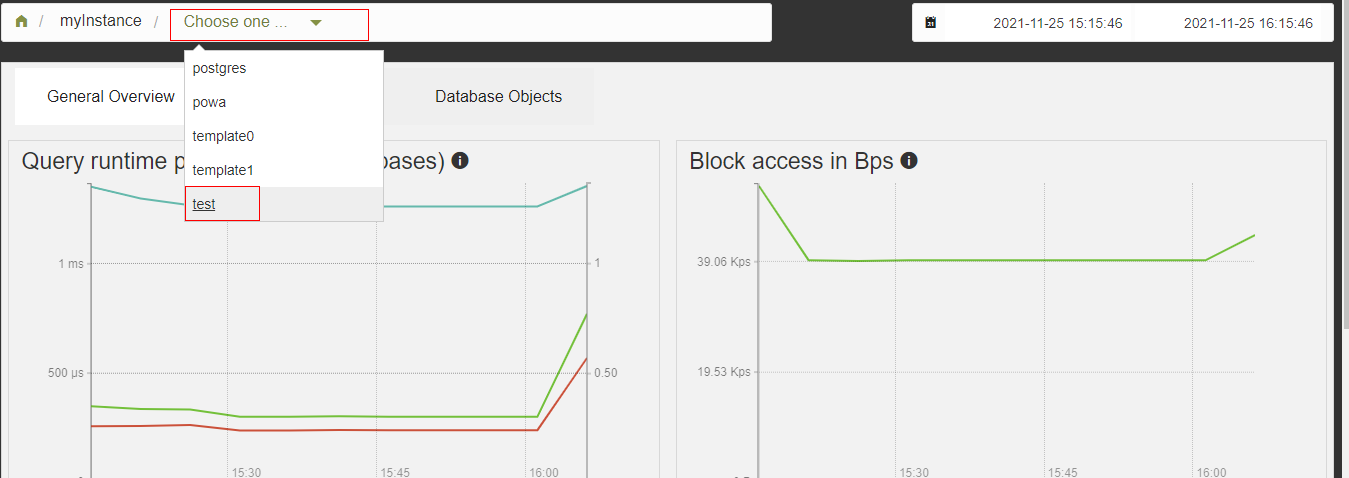
- After about 5 minutes, on the PoWA home page, select the target DB instance and select the test database.
Figure 1 PoWA home page

In Details for all queries, view that the execution time of the SELECT pg_sleep($1) statement is 20s.

Feedback
Was this page helpful?
Provide feedbackThank you very much for your feedback. We will continue working to improve the documentation.See the reply and handling status in My Cloud VOC.
For any further questions, feel free to contact us through the chatbot.
Chatbot


