Configuring the ROI
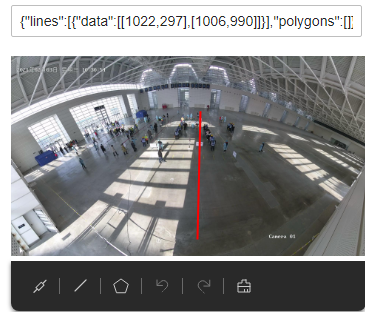
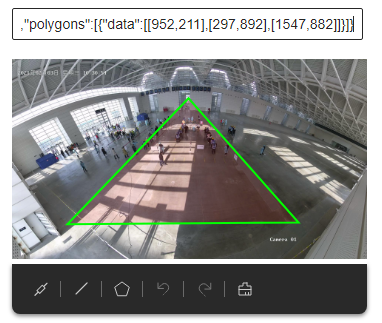
Region of Interest (ROI) indicates the detection area of an algorithm. Some algorithms require JSON strings indicating the detection area, for example, {"polygons":[{"data":[[84,389], [1840,349], [1824,526], [78,526]]}]}, where [84,389] indicates the horizontal and vertical coordinates, {"data":[...]} indicates a graph formed by connection lines of these coordinate points, and "polygons":[...]} indicates that multiple {"data":[...]} graphs are polygonal areas. The entire string example represents a polygonal area formed by the four coordinate points. Similarly, {"lines":[{"data":[[238,481], [1309,481]]}]} indicates a line segment formed by two coordinate points.
You can also draw an ROI. The platform automatically generates JSON strings indicating a detection area based on the drawing.
-
- To draw a straight-line segment, click
 .
Figure 1 Drawing a straight-line segment
- To draw a polygon, click
 . You do not need to draw the final line segment as it will be automatically completed when you double-click the mouse.
Figure 2 Drawing a polygon

- Make sure that the line segments of your polygon do not overlap while drawing it.
- You can draw multiple polygons in a graph.
- You can customize the name and color next to drawing area.
- To draw a straight-line segment, click
Feedback
Was this page helpful?
Provide feedbackThank you very much for your feedback. We will continue working to improve the documentation.See the reply and handling status in My Cloud VOC.
For any further questions, feel free to contact us through the chatbot.
Chatbot


