
Viewing and Downloading Slow Query Logs of a FlexusRDS for PostgreSQL Instance
Scenarios
Slow query logs record statements that exceed the log_min_duration_statement value. You can view log details to identify statements that are executing slowly and optimize the statements. You can also download slow query logs for service analysis.
Slow query logs generated within the last 30 days can be viewed.
FlexusRDS for PostgreSQL supports the following statement types:
- All statement types
- SELECT
- INSERT
- UPDATE
- DELETE
- CREATE
- DROP
- ALTER
- DO
- CALL
- COPY
- WITH
- OTHER
Parameter Description
| Parameter | Description |
|---|---|
| log_min_duration_statement | Specifies how many milliseconds a query has to run before it has to be logged. If this parameter is set to a smaller value, the number of log records increases, which increases disk I/O utilization and deteriorates the SQL performance. |
| log_statement | Specifies the SQL statement type. The value is ddl by default and cannot be changed. |
| cron.log_statement | Specifies whether to log all cron statements before running them. The default value is on. |
Viewing Log Details
- In the instance list, click the target instance name.
- Click the Logs tab. On the Slow Query Logs tab page, view details about slow SQL statements.

- You can view the slow query log records of a specified execution statement type or a specific time period.
- The log_min_duration_statement parameter determines when a slow query log is recorded. However, changes to this parameter do not affect already recorded logs. If this parameter is changed from 1,000 ms to 100 ms, FlexusRDS starts recording statements that meet the new threshold and still displays the previously recorded logs that do not meet the new threshold. For example, a 1,500 ms SQL statement that was recorded when the threshold was 1,000 ms will not be deleted now that the new threshold is 2,000 ms.
- Currently, a maximum of 2,000 slow log records can be displayed.
Downloading a Slow Query Log
- In the instance list, click the target instance name.
- Click the Logs tab and click Download Logs on the right.
- In the displayed dialog box, click Slow Query Logs.
- Locate the log file whose status is Preparation completed and click Download in the Operation column. Figure 1 Downloading a Slow Query Log
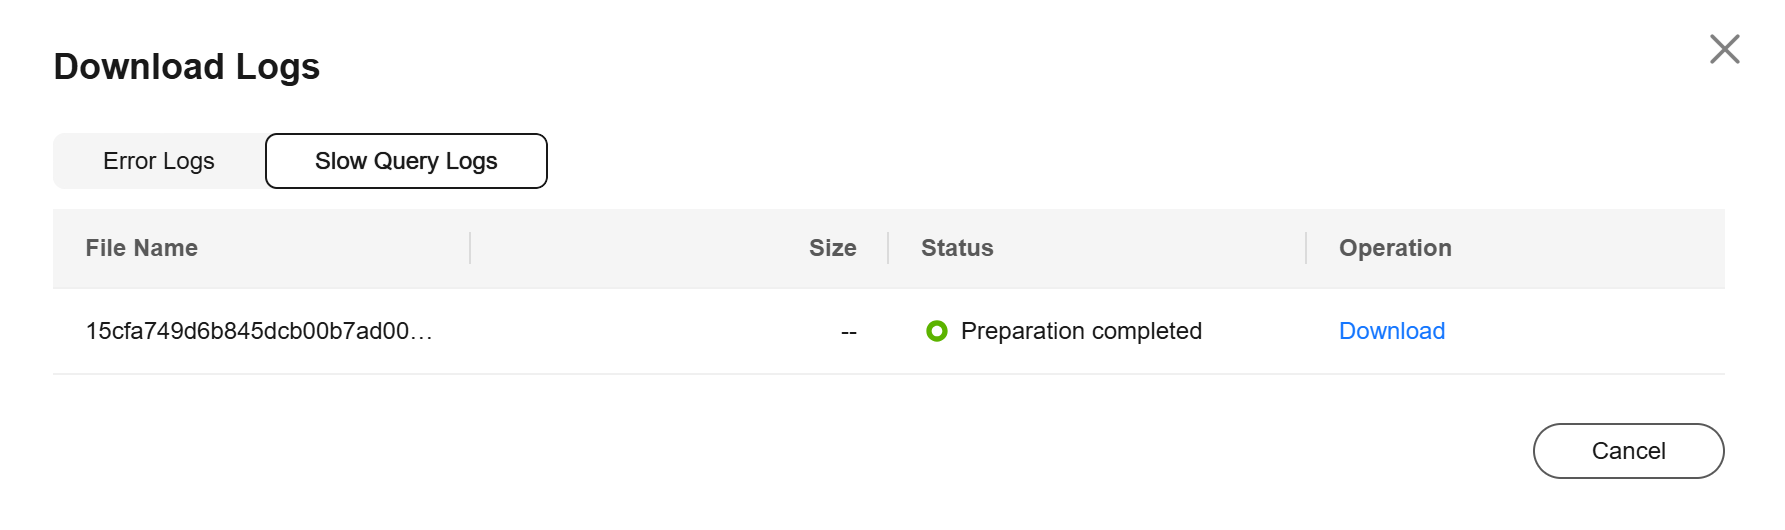
- The system automatically loads the downloading preparation tasks. The loading duration is determined by the log file size and network environment.
- When the log is being prepared for download, the log status is Preparing.
- When the log is ready for download, the log status is Preparation completed.
- If the preparation for download fails, the log status is Abnormal.
Logs in the Preparing or Abnormal status cannot be downloaded.
- Only logs no more than 40 MB can be downloaded directly from this page. The time range is calculated from the time you download the logs back to the time when the accumulated file size reaches 40 MB.
- The download link is valid for 5 minutes. After the download link expires, a message is displayed indicating that the download link has expired. If you need to redownload the log, click OK.
- The downloaded logs contain only the logs of the primary node.
- The system automatically loads the downloading preparation tasks. The loading duration is determined by the log file size and network environment.
Feedback
Was this page helpful?
Provide feedbackThank you very much for your feedback. We will continue working to improve the documentation.See the reply and handling status in My Cloud VOC.
For any further questions, feel free to contact us through the chatbot.
Chatbot


