Viewing Multi-Dimensional Cost Breakdowns
- Log in to Cost Center.
- Choose Cost Insights > Cost Analysis.
- Select the preconfigured report Multi-Dimension MTD Costs.


- The Multi-Dimension MTD Costs report is only available in the new edition of Cost Center. If you switch back to the old edition, you cannot access the report.
- The Multi-Dimension MTD Costs report does not include forecasted costs.
- On the Cost Analysis page, select your query criteria. The cost data within the selected time range will be displayed in the specified dimension.
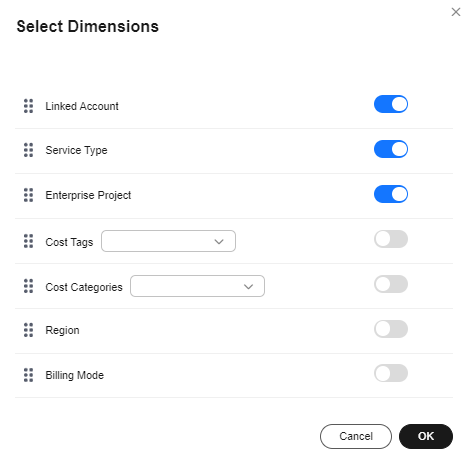
- Change the display dimensions.
Click Edit and select up to three dimensions.
The following display dimensions are available: Linked Account, Service Type, Enterprise Project, Cost Tags, Cost Categories, Region, and Billing Mode.


- The default display dimensions for multiple accounts are Linked Account, Service Type, and Enterprise Project.
- The default display dimensions for a single account are Service Type, Enterprise Project, and Region.
- View the cost Sankey diagram.
- By default, the MTD original costs are displayed. You can change the time range. This analysis report does not include forecasted costs.
- In the Sankey diagram, you can view your cost breakdowns and flows.
- The branch width of each display dimension is equal to that of the total cost. Each branch represents the cost breakdown in a particular dimension.
- The width of each branch represents costs incurred. The wider the branch, the higher the costs.
- The flow of each branch reflects the cost breakdown in each display dimension.

Up to 10 cost branches can be displayed for each dimension. The 10th branch and later branches are all displayed as Other.
- View cost data in the table.
- Click
 in the table to expand multi-dimensional cost data.
 - Click Export to export multi-dimensional cost data.
- Click
- Switch cost analysis views.
You can select another analysis view from the drop-down list. For example, you can switch to Favorite Reports, Recommended Reports, and Recent Reports.
- Change the display dimensions.
- Click Save As in the right upper corner of the page to save the analyses as reports so that you can easily view cost analyses with the same filters.
Feedback
Was this page helpful?
Provide feedbackThank you very much for your feedback. We will continue working to improve the documentation.See the reply and handling status in My Cloud VOC.
For any further questions, feel free to contact us through the chatbot.
Chatbot


