
Viewing Component Events
Component events are generated when you use components, including component deployment and scaling events. Visualized component events help you view component activities. If a fault occurs, you can view component events to locate the fault. Events are stored for 15 days. After 15 days, CAE will automatically clear the data.
CAE automatically interconnects with Application Operations Management (AOM). CAE component events are reported to AOM. You can view more alarm information about CAE component events on the alarm list page of the AOM console. For details, see Checking AOM Alarms or Events.
Prerequisites
- You have created an application. For details, see Creating an Application.
- You have created a component. For details, see Creating a Component.
Procedure
- Log in to CAE.
- Choose Component Events.
- By default, the Component Events page displays data generated in the last 30 minutes. For details, see Table 1. In the component list, you can click
 to filter components and click
  to switch the component sequence.
  indicates the default sorting order,
  indicates the ascending order, and
  indicates the descending order.
 Table 1 Component event information Parameter
Description
Event
Name of an event.
Severity
Severity of an event. The value can be Critical, Major, Minor, or Warning.
Type
Type of an event. The value can be Component events or Instances.
Instance
Name of an instance.
Occurrences
Number of times an event occurred.
Description
Event details.
First Occurred
Time when an event occurred for the first time.
Last Occurred
Time when an event occurred for the last time.
- View component events. You can set filter criteria to view events. The search criteria are as follows:
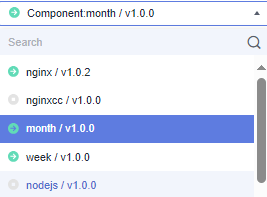
- Filter by component name: Select a component to filter and display the data generated in the last 30 minutes for the component. You can also search for and select a component from the drop-down list of the filter criteria.
- Filter by event severity: You can select All severities, Critical, Major, Minor, or Warning. Critical events require special attention.
- Filter by event type: You can select All, Components, or Instances.
- Search by event name: Enter an event name and click
 .
. 
Events help you view component activities. If a fault occurs, you can view component events to locate the fault.
- Filter by time: By default, the page displays the component data generated in the last 30 minutes. You can select the time filter in the upper right corner to view the data of the last hour, last 6 hours, last day, or last week. You can view the data of the last 15 days at most.
Feedback
Was this page helpful?
Provide feedbackThank you very much for your feedback. We will continue working to improve the documentation.See the reply and handling status in My Cloud VOC.
For any further questions, feel free to contact us through the chatbot.
Chatbot


