Help Center/
Graph Engine Service/
User Guide (Kuala Lumpur Region)/
Managing Graphs/
Viewing Monitoring Metrics
Updated on 2023-03-03 GMT+08:00
Viewing Monitoring Metrics
Scenario
It takes a period of time for transmitting and displaying data. The GES status displayed in the Cloud Eye monitoring data is the status obtained 5 to 10 minutes before. You can view the monitored data of a newly created graph 5 to 10 minutes later.
Prerequisites
- The created graph is running properly.
- The graph has been properly running for at least 10 minutes. For a newly created graph, you need to wait for a while before viewing its metrics.
- Cloud Eye does not display the metrics of a faulty or stopped graph. You can view the monitoring metrics after the graph starts or recovers.
Procedure
- Log in to the management console.
- In the navigation pane, choose Graph Management. In the Operation column, choose . The Cloud Eye management console is displayed.
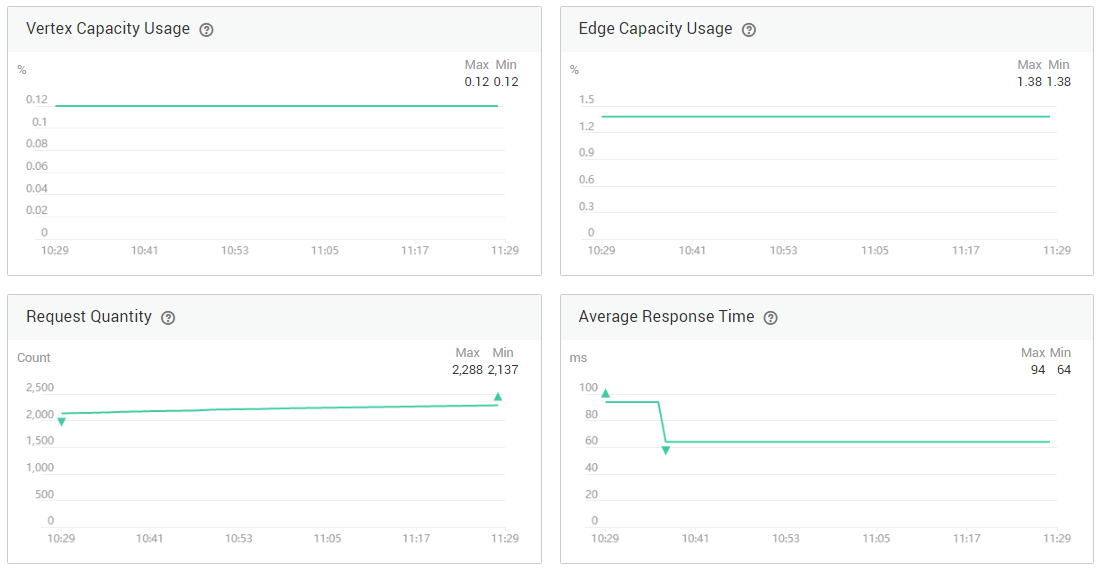
- On the monitoring page for GES, you can view the figures of all monitoring metrics.
Figure 1 Viewing monitoring metrics

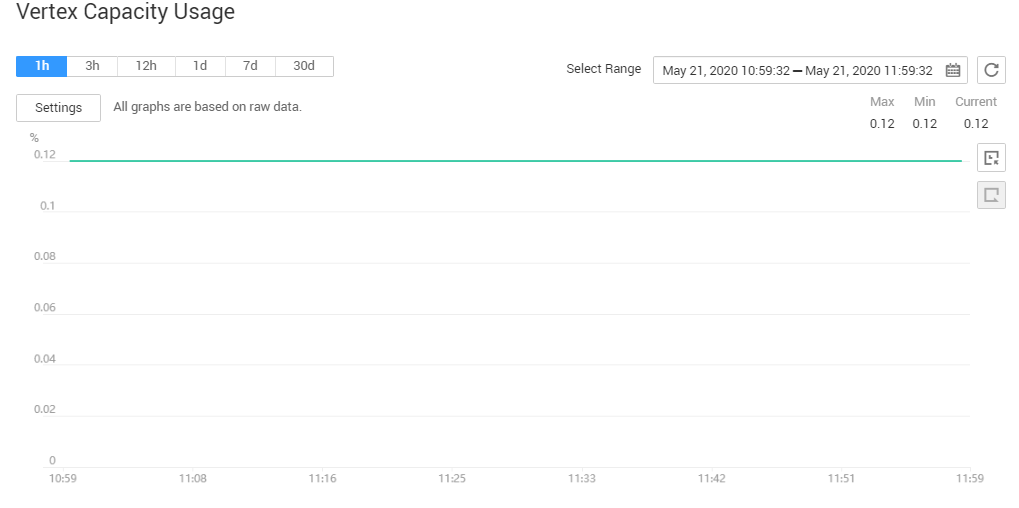
- To view the monitoring curve in a longer time range, click Full Image to view a chart in a bigger view.
Figure 2 Zoomed in graph

- The system allows you to select a fixed time range or use automatic refresh.
- Fixed time ranges include 1h, 3h, 12h, 1d, 7d, 30d.
Parent topic: Managing Graphs
Feedback
Was this page helpful?
Provide feedbackThank you very much for your feedback. We will continue working to improve the documentation.See the reply and handling status in My Cloud VOC.
The system is busy. Please try again later.
For any further questions, feel free to contact us through the chatbot.
Chatbot


