Monitoring Statistics Screen
Scenarios
There are always such scenarios as presentation, reporting, or real-time monitoring where you need to present the analysis results of SecMaster on big screens to achieve better demonstration effect. It is not ideal to just zoom in the console. Now, SecMaster Large Screen is a good choice for you to display the service console on bigger screens for a better visual effect.
By default, SecMaster provides a Monitoring Statistics screen. You can view the overview of unhandled alerts, incidents, vulnerabilities, and baseline settings on one screen.
Prerequisites
You have enabled Large Screen. For details, see Buying Value-Added Packages.
Viewing Monitoring Statistics Screen
- Log in to the SecMaster console.
- Click
 in the upper left corner of the management console and select a region or project.
 - In the navigation pane on the left, choose Workspaces > Management. In the workspace list, click the name of the target workspace.Figure 1 Workspace management page

- In the navigation pane on the left, choose Situation Awareness > Large Screen.Figure 2 Large Screen

- Click Play in the lower right corner of the monitoring statistics screen to open the page.
This screen includes many graphs. More details are provided below.
Monitoring Statistics Screen Overview
This screen displays the total number of unhandled alerts, incidents, vulnerabilities, and unsafe baseline settings. Figure 3 shows an example.
Parameter | Statistical Period | Update Frequency | Description |
|---|---|---|---|
Unhandled Alerts | Last 7 days | 5 minutes | Number of alerts to be handled in the last seven days. The alert data comes from the page in the current workspace. You can view more details on this page. |
Unhandled Incidents | Last 7 days | 5 minutes | Number of open or blocked incidents in the last seven days. The incident data comes from the page in the current workspace. You can view more details on this page. |
Unhandled Vulnerabilities | Real-time | 5 minutes | The number of unfixed vulnerabilities. To view details about the vulnerability data, choose in the current workspace. |
Unhandled Baseline Settings | Real-time | 5 minutes | The number of items failed to pass the baseline inspection. To view details about the baseline data, choose in the current workspace. |
Unhandled Alerts
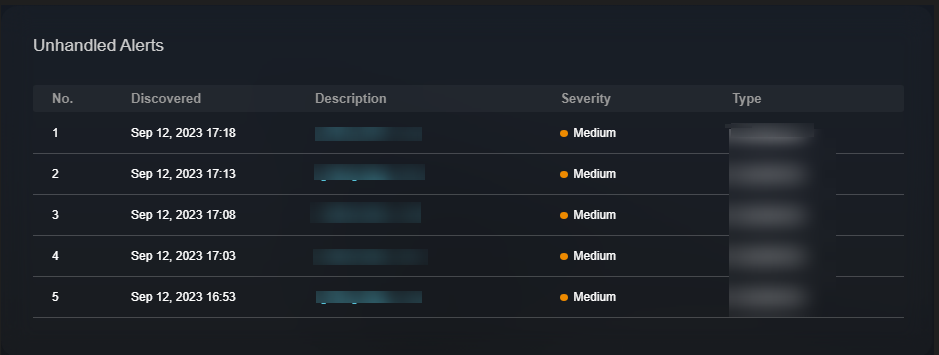
The table lists information about top 5 unhandled threat alerts, including the alert discovery time, alert description, alert severity, and alert type.
These top 5 alerts are sorted by generation time with the latest one placed at the top.
Parameter | Statistical Period | Update Frequency | Description |
|---|---|---|---|
Unhandled Alerts | Last 7 days | 5 minutes | Number of alerts that have not been handled for the last seven days. The alert data comes from the page in the current workspace. You can view more details on this page. |

Unhandled Incidents
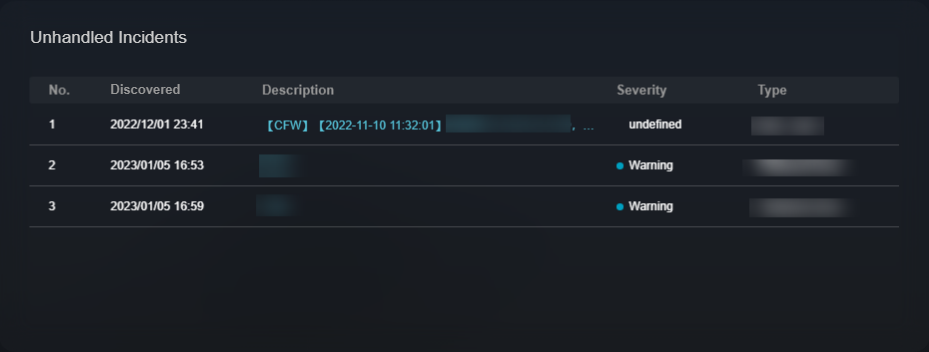
The table lists information about the top 5 unhandled incidents, including the incident discovery time, description, severity, and type. Figure 5 shows an example.
These top 5 incidents are sorted by generation time with the latest one placed at the top.
Parameter | Statistical Period | Update Frequency | Description |
|---|---|---|---|
Unhandled Incidents | Last 7 days | 5 minutes | Number of incidents that have not been closed in the last seven days. The incident data comes from the page in the current workspace. You can view more details on this page. |
Unhandled Vulnerabilities
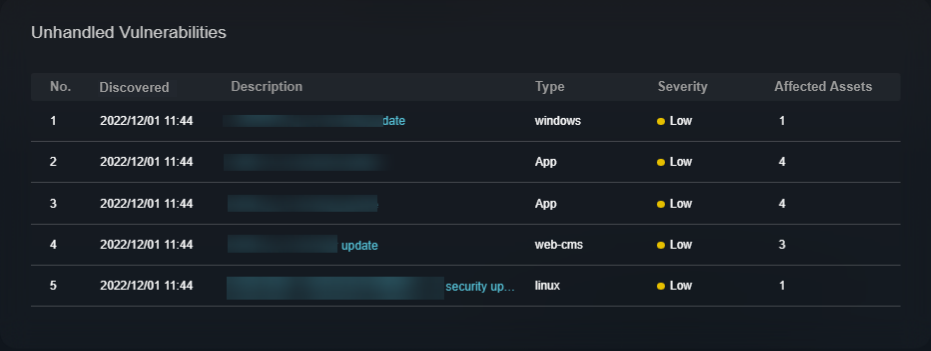
The table lists information about the top 5 unhandled vulnerabilities, including the discovery time, description, type, severity, and number of affected assets. Figure 6 shows an example.
These top 5 vulnerabilities are sorted by discovery time with the latest one placed at the top.
Parameter | Statistical Period | Update Frequency | Description |
|---|---|---|---|
Unhandled Vulnerabilities | Last 7 days | 5 minutes | The number of unfixed vulnerabilities. To view details about the vulnerability data, choose in the current workspace. |
Unhandled Baseline Settings
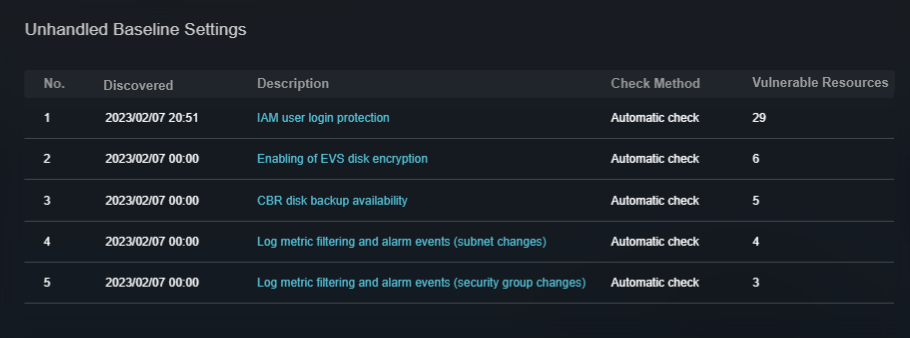
This table lists information about the top 5 unhandled unsafe baseline settings, including the discovery time, description, check method, and total number of vulnerable resources. Figure 7 shows an example.
These top 5 unhandled baseline settings are sorted by discovery time with the latest one placed at the top.
Parameter | Statistical Period | Update Frequency | Description |
|---|---|---|---|
Unhandled Baseline Settings | Last 7 days | 5 minutes | The number of items failed to pass the baseline inspection. To view details about the baseline data, choose in the current workspace. |
Feedback
Was this page helpful?
Provide feedbackThank you very much for your feedback. We will continue working to improve the documentation.See the reply and handling status in My Cloud VOC.
For any further questions, feel free to contact us through the chatbot.
Chatbot


