Daily Risk Prediction
Procedure
- Go to the Daily Risk Prediction page.
- Configure custom risk analysis or intelligent risk analysis as needed. By default, the Custom Risk Analysis page is displayed.

Currently, intelligent risk prediction is only available to whitelisted users.
- Custom risk analysis: a peak prediction method that identifies risky instances based on the input predicted peak value.
- Predicted peak value = Historical peak value in the reference period x (1 + Pressure coefficient)
- Risky instances: If either the historical peak capacity value or predicted peak value of an instance reaches the security threshold, the instance is considered risky and included in the risk report.
Table 1 lists the parameters for custom risk analysis.Table 1 Parameters for custom risk analysis Parameter
Description
Monitoring Date
Reference load data. The system identifies the peak capacity value within the monitoring period to predict peak capacity.
Pressure Coefficient
How many times service traffic increases. Predicted peak value = Peak capacity value within the effective period x (1 + Pressure coefficient)
In Aggregation Period
The maximum, minimum, and average values from raw data are calculated and collected over a period, which is referred to as an aggregation period. The system supports three aggregation periods: 1 hour, 4 hours, and 24 hours.
Trigger Condition
Number of consecutive times a specified condition must be met before the resource is considered as a risky instance.
Monitoring Scope
Risky resource scope. You can select Resource Groups or Resource.
Metric Name
Name of the metric to be analyzed.
Monitoring Policy
- Metric value type can be:
- Average is the value calculated by averaging raw data over an aggregation period.
- Maximum value is the maximum value of raw data over an aggregation period.
- Minimum value is the minimum value of raw data over an aggregation period.
- Safety Threshold indicates the threshold set for an analysis metric.
- Operator compares the metric value with the threshold.
Supported operators: >, >=, <, and <=
- Intelligent risk analysis: A trend prediction method that predicts the future capacity trend based on input value and algorithms.
- Predicted trend: The capacity trend of the next seven days is predicted based on the capacity trend in the reference period (within the last one month) using the prediction algorithms.
- Risky instance: If the capacity hits the safety limit during either the reference or prediction period, the instance is considered risky and included in the risk report.
Table 2 lists the parameters for intelligent risk analysis.Table 2 Parameters for intelligent risk analysis Parameter
Description
Reference Time Period
The prediction is based on the capacity trend in the reference time segment. By default, the end date matches the current time and cannot be changed.
Forecast Period
The intelligent prediction period in the next seven days cannot be changed.
In Aggregation Period
The maximum, minimum, and average values from raw data are calculated and collected over a period, which is referred to as an aggregation period. The system supports three aggregation periods: 1 hour, 4 hours, and 24 hours.
Trigger Condition
Number of consecutive times a specified condition must be met before the resource is considered as a risky instance.
Monitoring Scope
Risky resource scope. You can select Resource Groups or Resource.
Metric Name
Name of the metric to be analyzed.
Monitoring Policy
- Metric value type can be:
- Average is the value calculated by averaging raw data over an aggregation period.
- Maximum value is the maximum value of raw data over an aggregation period.
- Minimum value is the minimum value of raw data over an aggregation period.
- Safety Threshold indicates the threshold set for an analysis metric.
- Operator compares the metric value with the threshold.
Supported operators: >, >=, <, and <=
- Custom risk analysis: a peak prediction method that identifies risky instances based on the input predicted peak value.
- Click Risk Analysis to configure risk analysis.
- Set parameters in batches.
You can set the monitoring date, aggregation period, trigger condition, and pressure coefficient to set risk analysis parameters.

An instance appears in the analysis result list only after the threshold is reached for n consecutive times.
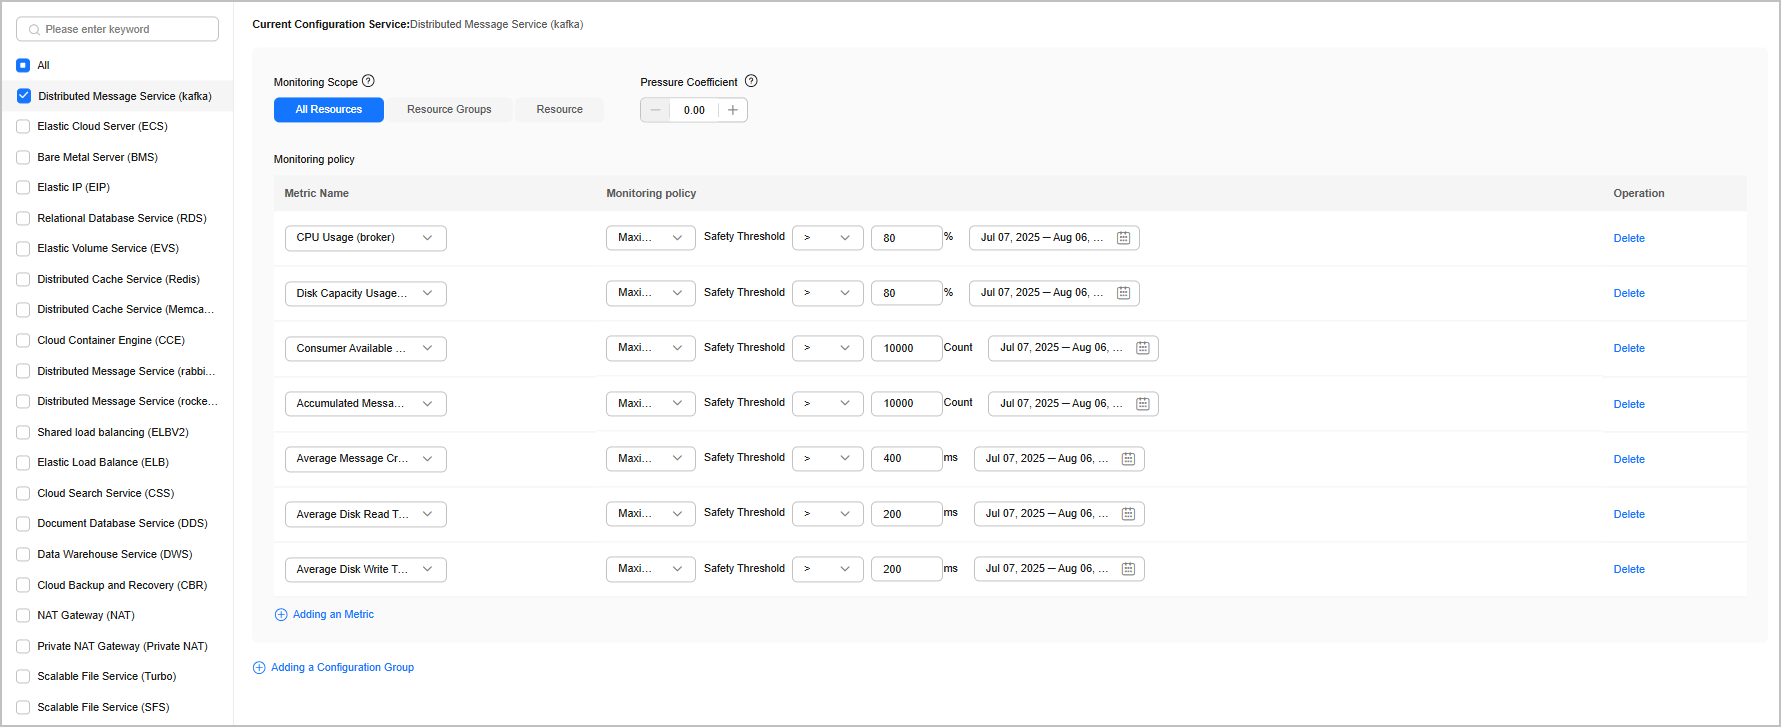
- Configure capacity thresholds.
- Selecting a cloud service: After you select the target cloud service, the system provides metric parameters by default. You can click Adding a Configuration Group to add, delete, or change metrics as needed.
- Configuring the monitoring scope: You can set different pressure coefficients and monitoring scopes for the selected cloud service. The monitoring scope can be All Resources, Resource Groups, or Resource.
- All Resources: All resources of the cloud service in your account are selected by default.
- Resource Groups: You can select resource groups created for the service. If no resource group is available, you are advised to create one by referring to Creating a Resource Group.
- Resource: You can query all resource instances of the service and select the desired ones.

- Set parameters in batches.
- Click Save and Analyze. The system starts the capacity risk check process. After the check is complete, the check result is automatically updated on the homepage. You can click Save to store your settings. This allows you to revisit the risk analysis page later for quick capacity checks.
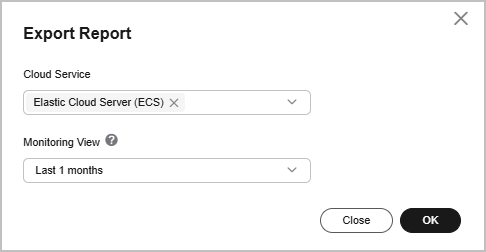
- Return to the Custom Risk Analysis page to view the check results. Click Export to download the check results.

Feedback
Was this page helpful?
Provide feedbackThank you very much for your feedback. We will continue working to improve the documentation.See the reply and handling status in My Cloud VOC.
For any further questions, feel free to contact us through the chatbot.
Chatbot


