
Configuring the Remote Write Address to Report Self-Built Prometheus Data to AOM
AOM can obtain the remote write address of a Prometheus instance. Native Prometheus metrics can then be reported to AOM through remote write. In this way, time series data can be stored for long.
Prerequisites
- You have created an ECS.
- Your service has been connected for Prometheus monitoring. For details, see Managing Prometheus Instances.
Reporting Self-Built Prometheus Instance Data to AOM
- Install and start open-source Prometheus. For details, see Prometheus official documents. (Skip this step if open-source Prometheus has been deployed.)
- Add an access code.
- Log in to the AOM 2.0 console.
- In the navigation pane, choose Settings > Global Settings. The Global Settings page is displayed.
- On the displayed page, choose Authentication in the navigation pane. Click Add Access Code.
- In the dialog box that is displayed, click OK. The system then automatically generates an access code.
An access code is an identity credential for calling APIs. A maximum of two access codes can be created for each project. Keep them secure.
- Obtain the configuration code for Prometheus remote write.
- Log in to the AOM 2.0 console.
- In the navigation pane on the left, choose Prometheus Monitoring > Instances. In the instance list, click the name of the target Prometheus instance.
- On the displayed page, choose Settings in the navigation pane and click
 on the right to copy the configuration code for Prometheus remote write from the Service Addresses area.
Figure 1 Configuration code for Prometheus remote write
on the right to copy the configuration code for Prometheus remote write from the Service Addresses area.
Figure 1 Configuration code for Prometheus remote write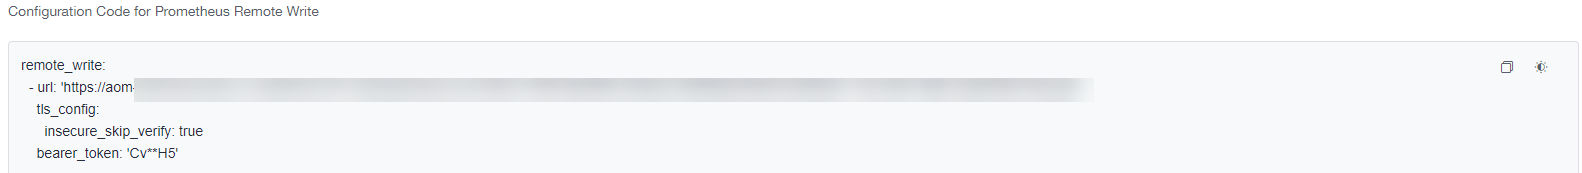
- Log in to the target ECS and configure the prometheus.yml file.
- Run the following command to find and start the prometheus.yml file:
./prometheus --config.file=prometheus.yml
- Add the configuration code for Prometheus remote write obtained in 3 to the end of the prometheus.yml file.
The following shows an example. You need to configure the italic part.
# my global config
global:
scrape_interval:     15s # Set the scrape interval to every 15 seconds. Default is every 1 minute.
evaluation_interval: 15s # Evaluate rules every 15 seconds. The default is every 1 minute.
# scrape_timeout is set to the global default (10s).

# Alertmanager configuration
alerting:
alertmanagers:
  - static_configs:
  - targets:
# - alertmanager:9093

# Load rules once and periodically evaluate them according to the global 'evaluation_interval'.
rule_files:
# - "first_rules.yml"
# - "second_rules.yml"

# A scrape configuration containing exactly one endpoint to scrape:
# Here it's Prometheus itself.
scrape_configs:
# The job name is added as a label `job=<job_name>` to any timeseries scraped from this config.
  - job_name: 'prometheus'

# metrics_path defaults to '/metrics'
# scheme defaults to 'http'.

static_configs:
  - targets: ['localhost:9090']
# Replace the italic content with the configuration code for Prometheus remote write obtained in 3.
remote_write:
  - url:'https://aom-**.***.{Site domain name suffix}:8443/v1/6d6df***2ab7/58d6***c3d/push'
    tls_config:
      insecure_skip_verify: true
    bearer_token: 'SE**iH'
- Run the following command to find and start the prometheus.yml file:
- Check the private domain name.
In the preceding example, data is reported through the intranet. Therefore, ensure that the host where Prometheus is located can resolve the private domain name.
- Restart Prometheus.
- View metric data in AOM using Grafana to check whether data is successfully reported after the preceding configurations are modified.
Feedback
Was this page helpful?
Provide feedbackThank you very much for your feedback. We will continue working to improve the documentation.See the reply and handling status in My Cloud VOC.
For any further questions, feel free to contact us through the chatbot.
Chatbot


