Querying Real-Time Traces
Scenarios
After you enable CTS and the management tracker is created, CTS starts recording operations on cloud resources. After a data tracker is created, the system starts recording operations on data in OBS buckets. CTS stores operation records generated in the last seven days.
This section describes how to query and export operation records of the last seven days on the CTS console.
Viewing Real-Time Traces in the Trace List of the New Edition
- Log in to the management console.
- Click
 in the upper left corner and choose Management & Deployment > Cloud Trace Service. The CTS console is displayed.
 - Choose Trace List in the navigation pane on the left.
- On the Trace List page, use advanced search to query traces. You can combine one or more filters.
- Trace Name: Enter a trace name.
- Trace ID: Enter a trace ID.
- Resource Name: Enter a resource name. If the cloud resource involved in the trace does not have a resource name or the corresponding API operation does not involve the resource name parameter, leave this field empty.
- Resource ID: Enter a resource ID. Leave this field empty if the resource has no resource ID or if resource creation failed.
- Trace Source: Select a cloud service name from the drop-down list.
- Resource Type: Select a resource type from the drop-down list.
- Operator: Select one or more operators from the drop-down list.
- Trace Status: Select normal, warning, or incident.
- normal: The operation succeeded.
- warning: The operation failed.
- incident: The operation caused a fault that is more serious than the operation failure, for example, causing other faults.
- Time range: Select Last 1 hour, Last 1 day, or Last 1 week, or specify a custom time range.
- On the Trace List page, you can also export and refresh the trace list, and customize the list display settings.
- Enter any keyword in the search box and click
 to filter desired traces.
 - Click Export to export all traces in the query result as an .xlsx file. The file can contain up to 5000 records.
- Click
 to view the latest information about traces.
 - Click
 to customize the information to be displayed in the trace list. If Auto wrapping is enabled (
 ), excess text will move down to the next line; otherwise, the text will be truncated. By default, this function is disabled.
- Enter any keyword in the search box and click
- For details about key fields in the trace structure, see section "Trace References" > "Trace Structure" and section "Trace References" > "Example Traces".
- (Optional) On the Trace List page of the new edition, click Go to Old Edition in the upper right corner to switch to the Trace List page of the old edition.
Viewing Real-Time Traces in the Trace List of the Old Edition
- Log in to the management console.
- Click
 in the upper left corner and choose Management & Deployment > Cloud Trace Service. The CTS console is displayed.
 - Choose Trace List in the navigation pane on the left.
- Each time you log in to the CTS console, the new edition is displayed by default. Click Go to Old Edition in the upper right corner to switch to the trace list of the old edition.
- Set filters to search for your desired traces. The following filters are available:
- Trace Type, Trace Source, Resource Type, and Search By: Select a filter from the drop-down list.
- If you select Resource ID for Search By, specify a resource ID.
- If you select Trace name for Search By, specify a trace name.
- If you select Resource name for Search By, specify a resource name.
- Operator: Select a user.
- Trace Status: Select All trace statuses, Normal, Warning, or Incident.
- Time range: You can query traces generated during any time range in the last seven days.
- Click Export to export all traces in the query result as a CSV file. The file can contain up to 5000 records.
- Trace Type, Trace Source, Resource Type, and Search By: Select a filter from the drop-down list.
- Click Query.
- On the Trace List page, you can also export and refresh the trace list.
- Click Export to export all traces in the query result as a CSV file. The file can contain up to 5000 records.
- Click
 to view the latest information about traces.
- Click
 on the left of a trace to expand its details.

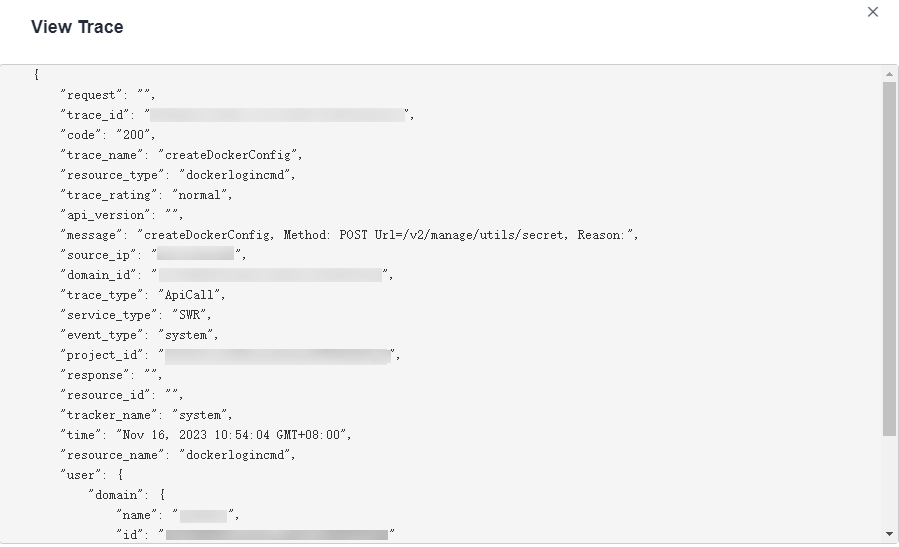
- Click View Trace in the Operation column. The trace details are displayed.

- For details about key fields in the trace structure, see section "Trace References" > "Trace Structure" and section "Trace References" > "Example Traces".
- (Optional) On the Trace List page of the old edition, click New Edition in the upper right corner to switch to the Trace List page of the new edition.
Feedback
Was this page helpful?
Provide feedbackThank you very much for your feedback. We will continue working to improve the documentation.See the reply and handling status in My Cloud VOC.
For any further questions, feel free to contact us through the chatbot.
Chatbot


