ALM-43013 JDBCServer2x Process GC Time Exceeds the Threshold
Alarm Description
The system checks the garbage collection (GC) time of the JDBCServer2x Process every 60 seconds. This alarm is generated when the detected GC time exceeds the threshold (exceeds 12 seconds for three consecutive checks.) To change the threshold, choose O&M > Alarm > Thresholds > Spark2x > GC Time > Total GC time in milliseconds (JDBCServer2x). This alarm is cleared when the JDBCServer2x GC time is shorter than or equal to the threshold.

In MRS 3.3.0-LTS and later versions, the Spark2x component is renamed Spark, and the role names in the component are also changed. For example, JDBCServer2x is changed to JDBCServer. Refer to the descriptions and operations related to the component name and role names in the document based on your MRS version.
Alarm Attributes
|
Alarm ID |
Alarm Severity |
Auto Cleared |
|---|---|---|
|
43013 |
Major |
Yes |
Alarm Parameters
|
Parameter |
Description |
|---|---|
|
Source |
Specifies the cluster for which the alarm is generated. |
|
ServiceName |
Specifies the service name for which the alarm is generated. |
|
RoleName |
Specifies the role name for which the alarm is generated. |
|
HostName |
Specifies the object (host ID) for which the alarm is generated. |
|
Trigger Condition |
Generates an alarm when the actual indicator value exceeds the specified threshold. |
Impact on the System
If the GC duration exceeds the threshold, the performance of the JDBCServer2x process deteriorates, and the process can even be unavailable. As a result, Spark JDBC tasks are slow or fail to run.
Possible Causes
The memory of JDBCServer2x is overused, the heap memory is inappropriately allocated. As a result, GCs occur frequently.
Handling Procedure
Check the GC time.
- On the FusionInsight Manager portal, choose O&M > Alarm > Alarms and select the alarm whose ID is 43013. Check the RoleName in Location and confirm the IP address of HostName.
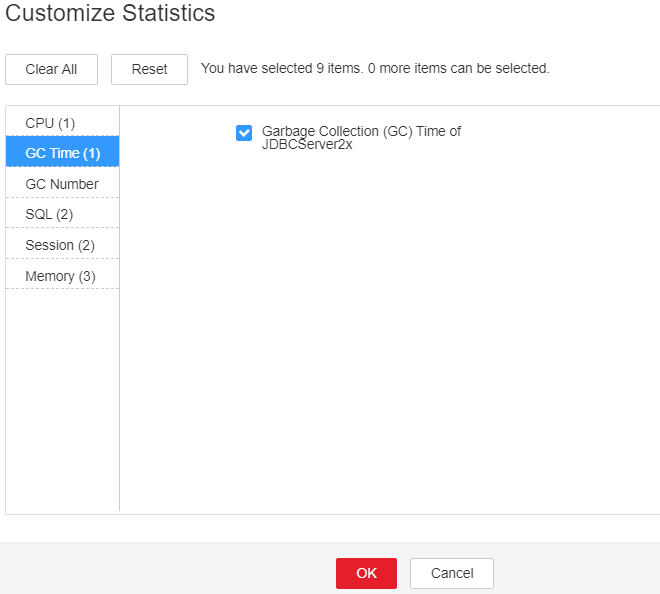
- On the FusionInsight Manager homepage, choose Cluster > Services > Spark2x > Instances and click the JDBCServer2x for which the alarm is generated to go to the Dashboard page. Click the drop-down menu in the Chart area, choose Customize > GC Time > Garbage Collection (GC) Time of JDBCServer2x from the drop-down list box in the upper right corner, and click OK to check whether the GC time is longer than the threshold (default value: 12 seconds).
Figure 1 Garbage Collection (GC) Time of JDBCServer2x

- On the FusionInsight Manager portal, choose Cluster > Services > Spark2x > Configurations, and click All Configurations. Choose JDBCServer2x > Default. The default value of SPARK_DRIVER_MEMORY is 4 GB. If this alarm is generated occasionally, increase the value by 0.5 times. If the alarm is frequently reported, increase the value by 1 time. In the case of large service volume and high service concurrency, you are advised to add instances.
- Restart all JDBCServer2x instances.

When the instance is rebooted, it cannot be used and any tasks running on the current instance node will fail.
- After 10 minutes, check whether the alarm is cleared.
- If yes, no further action is required.
- If no, go to Step 6.
Collect fault information.
- On the FusionInsight Manager interface of active and standby clusters, choose O&M > Log > Download.
- Select Spark2x in the required cluster from the Service.
- Click
 in the upper right corner, and select a time span starting 10 minutes before and ending 10 minutes after when the alarm was generated. Then, click Download to collect the logs.
 - Send the collected fault logs to O&M personnel for help.
Alarm Clearance
After the fault is rectified, the system automatically clears this alarm.
Related Information
None
Feedback
Was this page helpful?
Provide feedbackThank you very much for your feedback. We will continue working to improve the documentation.See the reply and handling status in My Cloud VOC.
For any further questions, feel free to contact us through the chatbot.
Chatbot


