

ALM-38001 Insufficient Kafka Disk Capacity
Description
The system checks the Kafka disk usage every 60 seconds and compares the actual disk usage with the threshold. The disk usage has a default threshold. This alarm is generated when the disk usage is greater than the threshold.
You can change the threshold in O&M > Alarm > Thresholds. Under the service list, choose Kafka > Disk > Broker Disk Usage (Broker) and change the threshold.
When the Trigger Count is 1, this alarm is cleared when the Kafka disk usage is less than or equal to the threshold. When the Trigger Count is greater than 1, this alarm is cleared when the Kafka disk usage is less than or equal to 80% of the threshold.
Attribute
| Alarm ID | Alarm Severity | Automatically Cleared |
|---|---|---|
| 38001 | Major (default value: 85%) Critical (default value: 90%) | Yes |
Parameters
| Name | Meaning |
|---|---|
| Source | Specifies the cluster for which the alarm is generated. |
| ServiceName | Specifies the service for which the alarm is generated. |
| RoleName | Specifies the role for which the alarm is generated. |
| HostName | Specifies the host for which the alarm is generated. |
| PartitionName | Specifies the disk partition where the alarm is generated. |
| Trigger Condition | Specifies the threshold triggering the alarm. If the current indicator value exceeds this threshold, the alarm is generated. |
Impact on the System
Kafka data write operations are affected.
Possible Causes
- The configuration (such as number and size) of the disks for storing Kafka data cannot meet the requirement of the current service traffic, due to which the disk usage reaches the upper limit.
- Data retention time is too long, due to which the data disk usage reaches the upper limit.
- The service plan does not distribute data evenly, due to which the usage of some disks reaches the upper limit.
Procedure
Check the disk configuration of Kafka data.
- Log in to MRS Manager and choose O&M > Alarm > Alarms.
For details about how to log in to FusionInsight Manager, see Accessing MRS Manager.
- In the alarm list, view the alarm details to obtain the names of the host and the partition for which the alarm is generated.
- On Manager, choose Hosts and click the host name obtained in Step 2.
- Check whether the Disk area contains the partition for which the alarm is generated.
- If yes, go to Step 5.
- If no, click Clear in the Operation column of the alarm to manually clear the alarm.
- Check whether the disk partition usage contained in the alarm reaches 100% in the Disk area.
- If yes, handle the alarm by following the instructions in Related Information.
- If no, go to Step 6.
Check the Kafka data retention duration.
- Choose Cluster > Services > Kafka and click Configurations then All Configurations.
- Check whether the value of the parameter disk.adapter.enable is set to true.
The disk.adapter.enable parameter indicates whether to enable the disk adaptation. Its default value is false.
- Set the value of disk.adapter.enable to true. Then, check whether the minimum data retention period specified by adapter.topic.min.retention.hours is properly configured.
- If yes, go to Step 9.
- If no, adjust the data retention period based on service requirements.

Enabling the disk adaptation function may cause historical data of some topics to be deleted. If the retention period of some topics does not need to be adjusted, search for the disk.adapter.topic.blacklist parameter and add the topics to the parameter value. This parameter specifies the list of topics to be excluded from disk adaption.
- Wait 10 minutes and check whether the usage of faulty disks reduces.
- If yes, wait until the alarm is cleared.
- If no, go to Step 10.
Check the Kafka data plan.
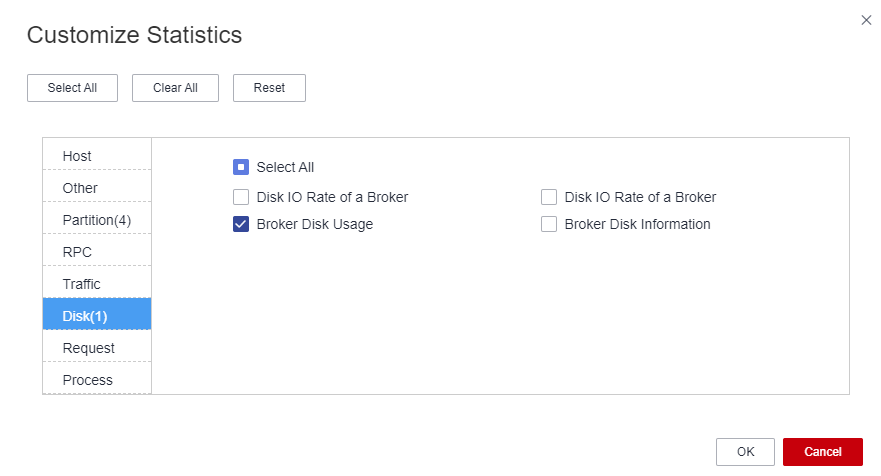
- Choose Cluster > Services > Kafka > Instances, and click the Broker role corresponding to the host name of the instance for which the alarm is generated. Click the drop-down list in the upper right corner of the Chart area and choose Customize.
- In the dialog box, select Disk > Broker Disk Usage and click OK.
The Kafka disk usage information is displayed.
Figure 1 Broker Disk Usage
- View the information in Step 11 to check whether there is only the disk parathion for which the alarm is generated in Step 2.
- Perform disk planning and mount a new disk by referring to Kafka Service Specifications.
- On Manager, choose Cluster > Services > Kafka > Instances, click the Broker role corresponding to the host name of the instance for which the alarm is generated, click the Instance Configuration tab, search for and reconfigure the log.dirs parameter, add the paths of other disks, and save the configuration.
On the Instances page of the Kafka component, select the Broker role corresponding to the host name of the instance for which the alarm is generated, choose More > Instance Rolling Restart, and restart the current Kafka instance as prompted.

If the current topic has multiple replicas during the instance rolling restart, there is no impact on the Kafka service. Otherwise, the Kafka service will be unavailable during the restart, and upper-layer services that depend on the service will be affected.
- On Manager, choose Cluster > Services > Kafka > Configurations > All Configurations, search for the log.retention.hours parameter, and determine whether it is necessary to shorten the data retention time based on service requirements and service volume.
- Decrease the value of log.retention.hours based on service requirements.
- The value of log.retention.hours is the default data retention time of the topic.
- For a topic whose data retention time is configured alone, the modification of the data retention time on the Kafka Service Configuration page does not take effect.
- To modify the data retention time for a single topic, use the Kafka client command-line interface (CLI) to configure the topic. Example:
kafka-topics.sh --zookeeper IP address of ZooKeeper:2181/kafka --alter --topic Topic name --config retention.ms=Retention time
- Check whether partitions are properly configured for topics. For example, if the number of partitions for a topic with a large data volume is smaller than the number of disks, data may be unevenly distributed to the disks and the usage of some disks will reach the upper limit.
If you do not know which topics have a large amount of service data, perform the following steps:
- Log in to an instance node based on the host node information obtained in Step 2.
For details about how to log in to a cluster node, see Logging In to an MRS Cluster Node.
- Go to the data directory (directory specified by log.dirs before the modification in Step 14).
- Run the following command to check whether there is topic with partition that use large disk space.
- Log in to an instance node based on the host node information obtained in Step 2.
- Add partitions to a topic on the Kafka client.
- Log in to the node where the client is installed as the client installation user.
- Run the following command to go to the client installation directory, for example, /opt/client.
cd /opt/client - Run the following command to configure environment variables.
source bigdata_env
- Run the following command to perform user authentication. (Skip this step if Kerberos authentication is disabled for the cluster (in normal mode).)
kinit Component service user - Run the following command to go to the bin directory of the Kafka client:
cd Kafka/kafka/bin
- Run the following command to add partitions to the topic:
kafka-topics.sh --zookeeper IP address of ZooKeeper:2181/kafka --alter --topic Topic name --partitions=Number of new partitions
- You are advised to set the new number of partitions to a multiple of the number of Kafka data disks.
- Obtain the service IP address and port number of the ZooKeeper node.
- Choose Cluster > Services > ZooKeeper > Instances and record the service IP address of any ZooKeeper instance.
- Click Configuration and then All Configurations, search for clientPort, and record the port number.
When creating an LTS cluster, you can set Component Port to Open source or Custom. If you select Open source, the default ZooKeeper port is 2181. If you select Custom, the default ZooKeeper port is 24002.
- The step may not quickly clear the alarm, and you need to modify the data retention time in Step 10 to gradually balance data allocation.
- Determine whether to expand the disk capacity based on the site requirements.
You are advised to expand the capacity when the Kafka disk usage exceeds 80%.
- Contact O&M personnel engineers to expand the disk capacity. After the expansion, check whether the alarm is cleared.
- If yes, no further action is required.
- If no, go to Step 22.
- Check whether the alarm is cleared.
- If yes, no further action is required.
- If no, go to Step 22.
Collect fault information.
- On the FusionInsight Manager portal, choose O&M > Log > Download.
- Select Kafka in the required cluster from the Service drop-down list.
- Click
 in the upper right corner, and set Start Date and End Date for log collection to 10 minutes ahead of and after the alarm generation time, respectively. Then, click Download.
 - Send the collected fault logs to O&M personnel for help.
Alarm Clearing
After the fault is rectified, the system automatically clears this alarm.
Related Information
- Log in to MRS Manager, choose Cluster > Services > Kafka > Instances, select the Broker instance whose status is Restoring, choose More > Stop Instance, and record the management IP address of the node where the instance resides. Click the Broker role name. On the Instance Configurations page, select All Configurations, search for the broker.id parameter, and record its value.
- Log in to the recorded management IP address as user root, and run the df -lh command to view the mounted directory whose disk usage is 100%. For details about how to log in to a cluster node, see Logging In to an MRS Cluster Node.
df -lh
For example, the mounted directory whose usage reaches 100% is ${BIGDATA_DATA_HOME}/kafka/data1.
- Run the following commands to go to the directory and check the size of each folder in the directory:
cd Mounted directorydu -sh *
Check whether there are files in addition to the files in the kafka-logs directory, and determine whether these files can be deleted or migrated.
- Run the following commands to go to the kafka-logs directory and check the size of each folder:
cd kafka-logs
du -sh *
Select a partition folder to be moved. The folder is named in the format of Topic name-Partition ID. Record the topic and partition.
- Modify the recovery-point-offset-checkpoint and replication-offset-checkpoint files in the kafka-logs directory in the same way.
- Decrease the number in the second line in the file. (To remove multiple directories, the number deducted is equal to the number of files to be removed.)
- Delete the line of the to-be-removed partition. (The line structure is "Topic name Partition ID Offset". Save the data before deletion. Subsequently, the content must be added to the file of the same name in the destination directory.)
- Modify the recovery-point-offset-checkpoint and replication-offset-checkpoint files in the destination data directory. For example, ${BIGDATA_DATA_HOME}/kafka/data2/kafka-logs in the same way.
- Increase the number in the second line in the file. (To move multiple directories, the number added is equal to the number of files to be moved.)
- Add the to-be moved partition to the end of the file. (The line structure is "Topic name Partition ID Offset". You can copy the line data saved in Step 5.)
- Move the partition to the destination directory. After the partition is moved, run the following command to modify the owner group for the partition directory:
chown omm:wheel -R Partition directory - Log in to MRS Manager, choose Cluster > Services > Kafka > Instances, select the stopped Broker instance, and click Start Instance to start it.
- Wait for 5 to 10 minutes and check whether the health status of the Broker instance is Normal.
- If yes, resolve the disk capacity insufficiency problem according to the handling method of "ALM-38001 Insufficient Kafka Disk Space" after the alarm is cleared.
- If no, contact the O&M personnel.
What is your overall rating for this page?
Thank you very much for your feedback. We will continue working to improve the documentation.See the reply and handling status in My Cloud VOC.
For any further questions, feel free to contact us through the chatbot.
Chatbot


