Device Management
Overview
- Add a physical device on the Device Management page. The device name is defined by the developer. When the device development is complete, developers can add physical devices on the Developer Center where developers can perform end-to-end testing on the physical devices, codecs, and NAs.
- Add a virtual device on the Device Management page. The device name is defined by the IoT platform. The name of the virtual device is in the format of Product Name+Simulator. Only one virtual device can be added for each product. When the device development is not complete, developers can create a virtual device on the Developer Center to test the codecs and NAs.
Adding a Physical Device
- Choose and click Add Physical Device.
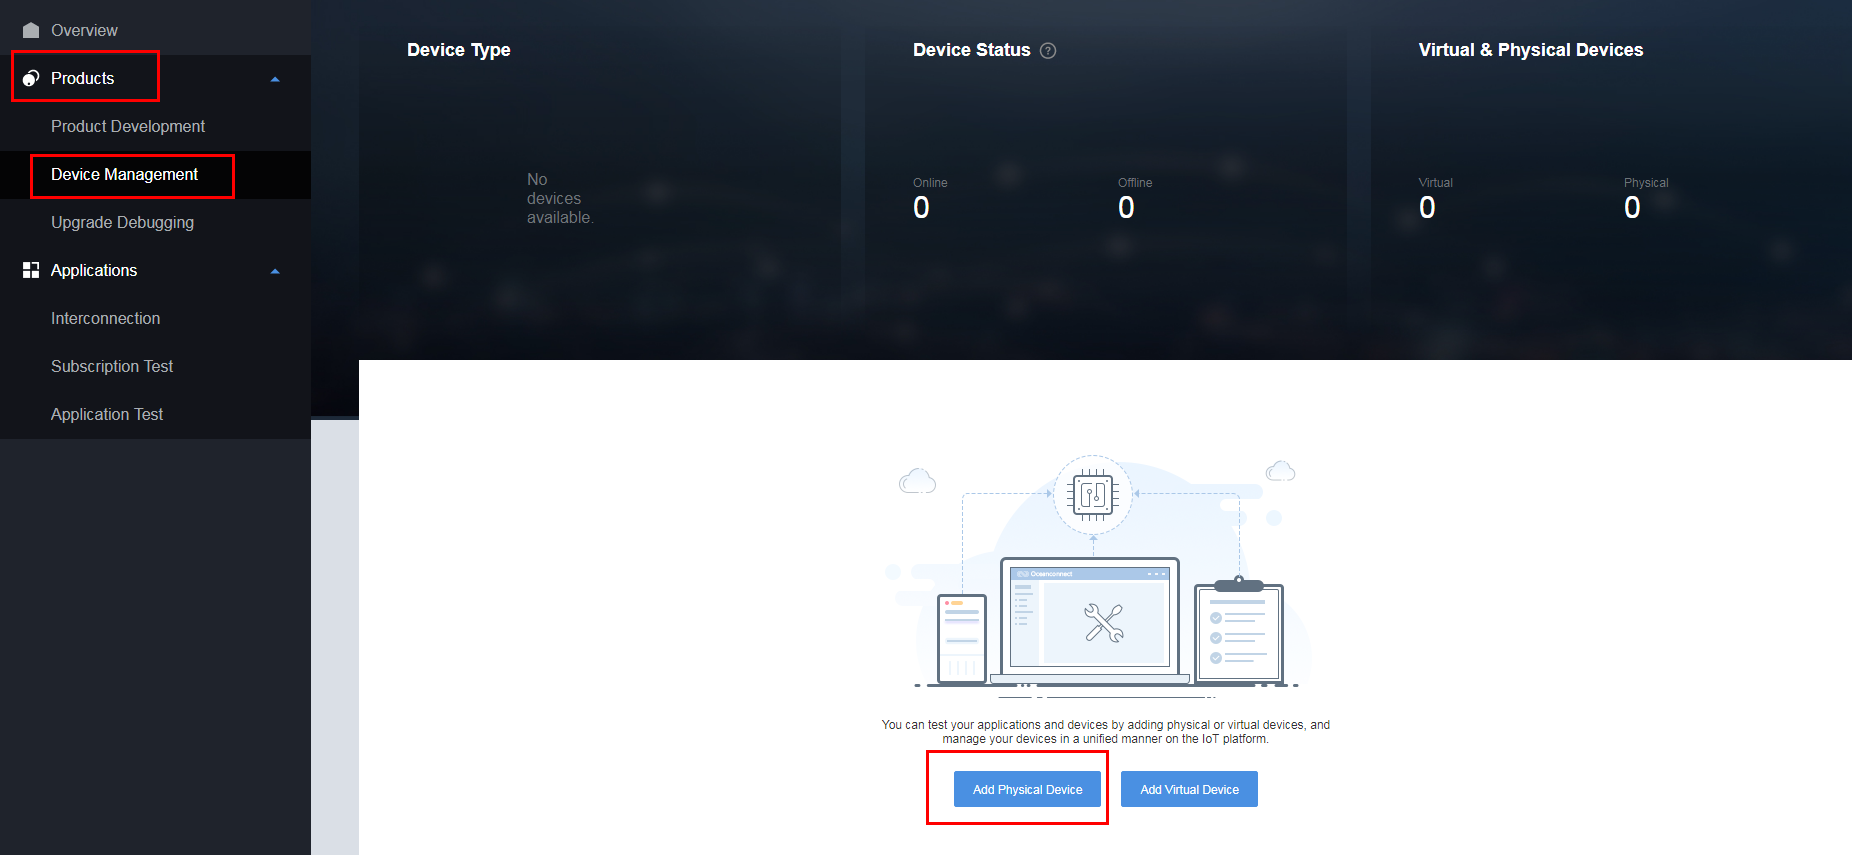
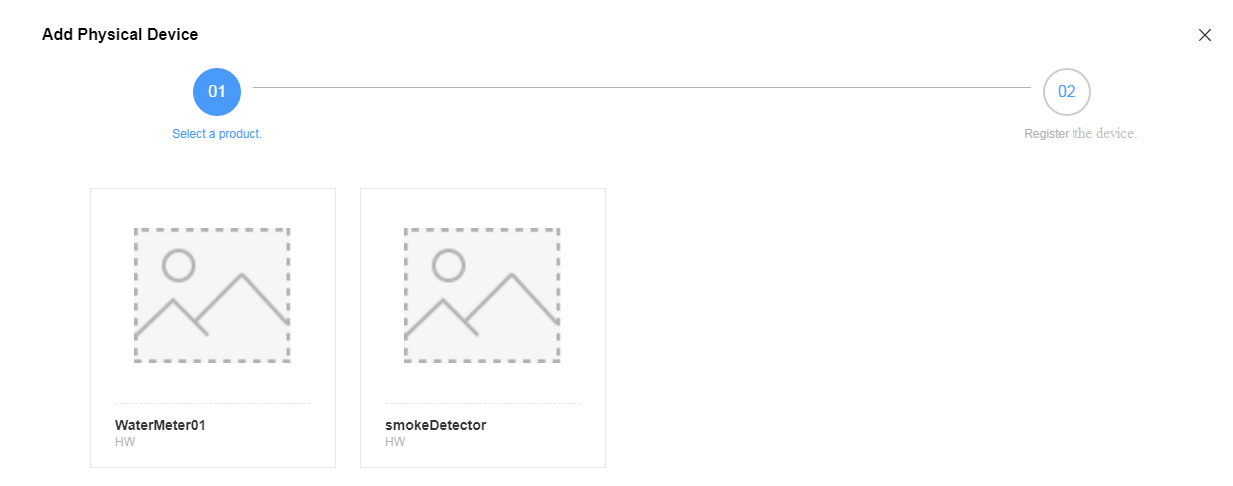
- In the Add Physical Device dialog box displayed, select a device.
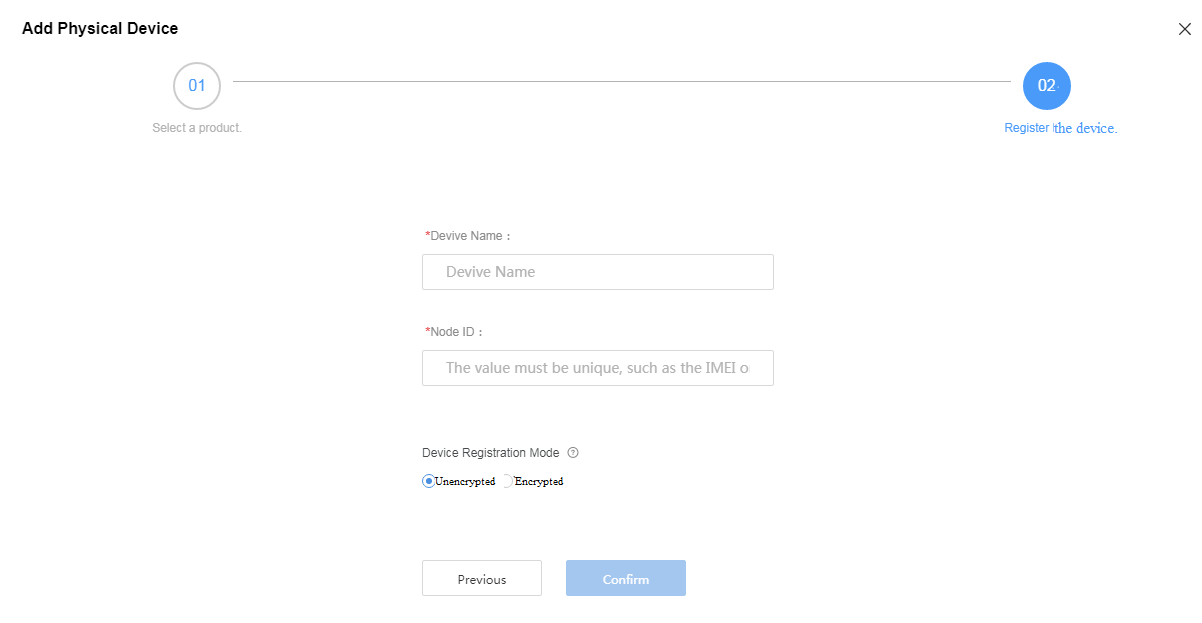
- Configure device information and click Confirm.
- Device Name can contain only letters, digits, and underscores (_) and must be unique in the product.
- Node ID must be set to a unique value, such as the IMEI or MAC address of the device.
- Select Unencrypted or Encrypted based on site requirements. If this parameter is set to Unencrypted, the device uses the CoAP/UDP protocol to connect to the IoT platform. If this parameter is set to Encrypted, the device uses the CoAPS/DTLS protocol to connect to the IoT platform.
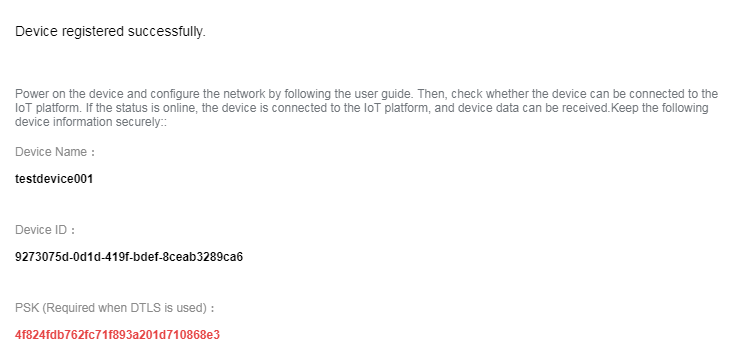
After the device is added, Device ID and PSK are returned. Keep the PSK securely as it is required when the device uses DTLS to connect to the IoT platform.
- After a physical device is added, you can view details and perform tests on the device and the application.

- In the device list, click the newly added device. On the page displayed, you can view device information, historical data, logs, and historical commands.
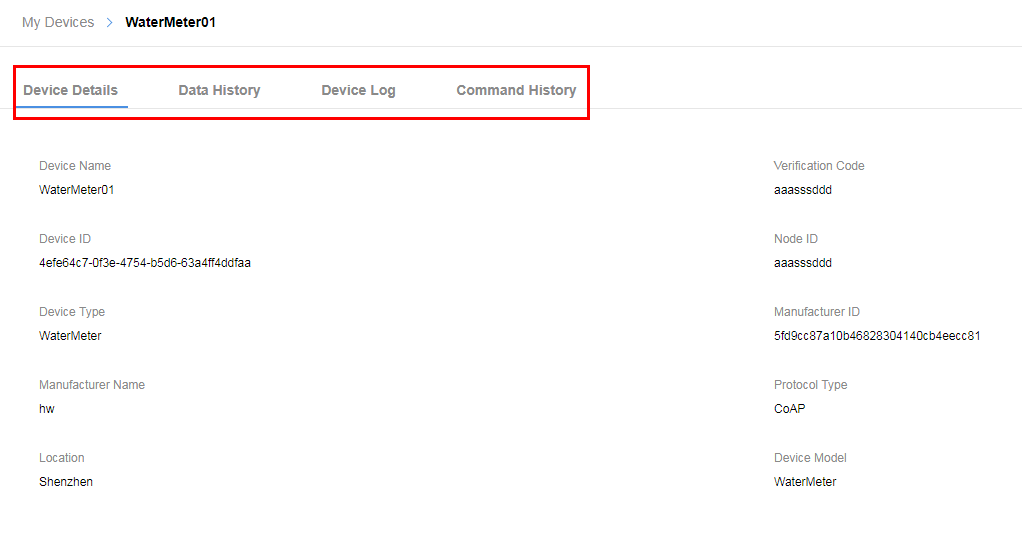
- In the device list, click Test Product at the row where the newly added device resides to test the product.
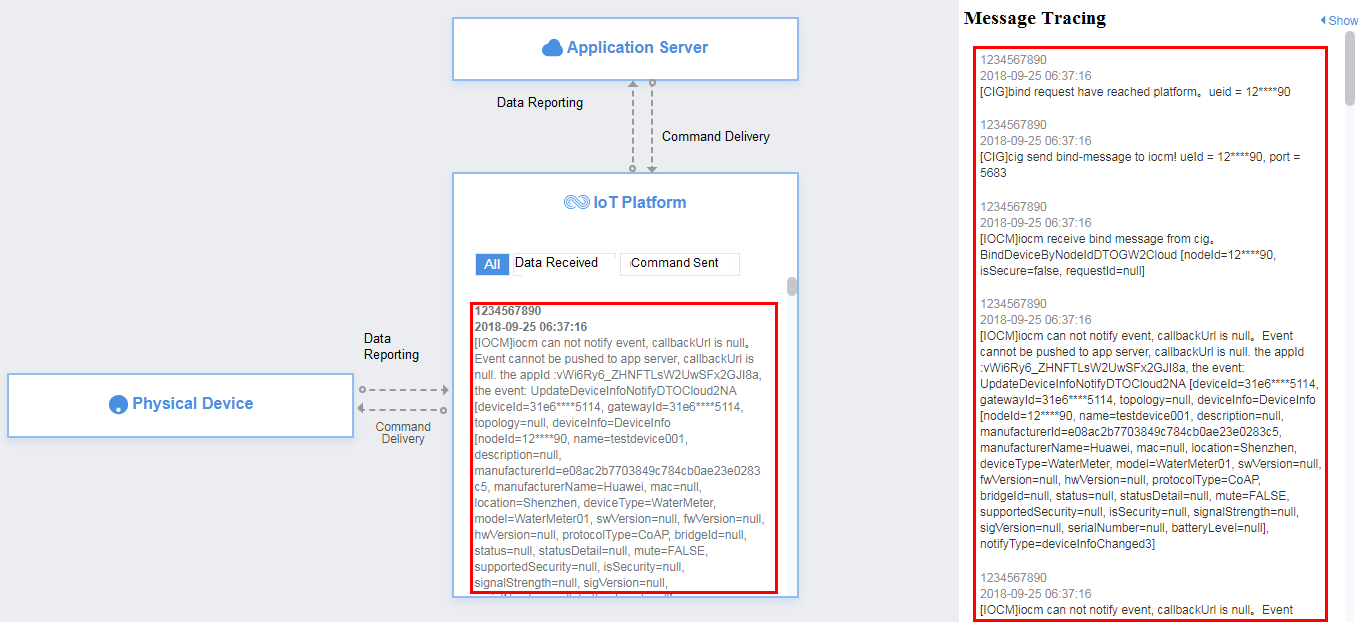
Connect the device to the IoT platform and report data. View the data reporting result in Application Simulator and processing logs of the IoT platform in Message Tracing.
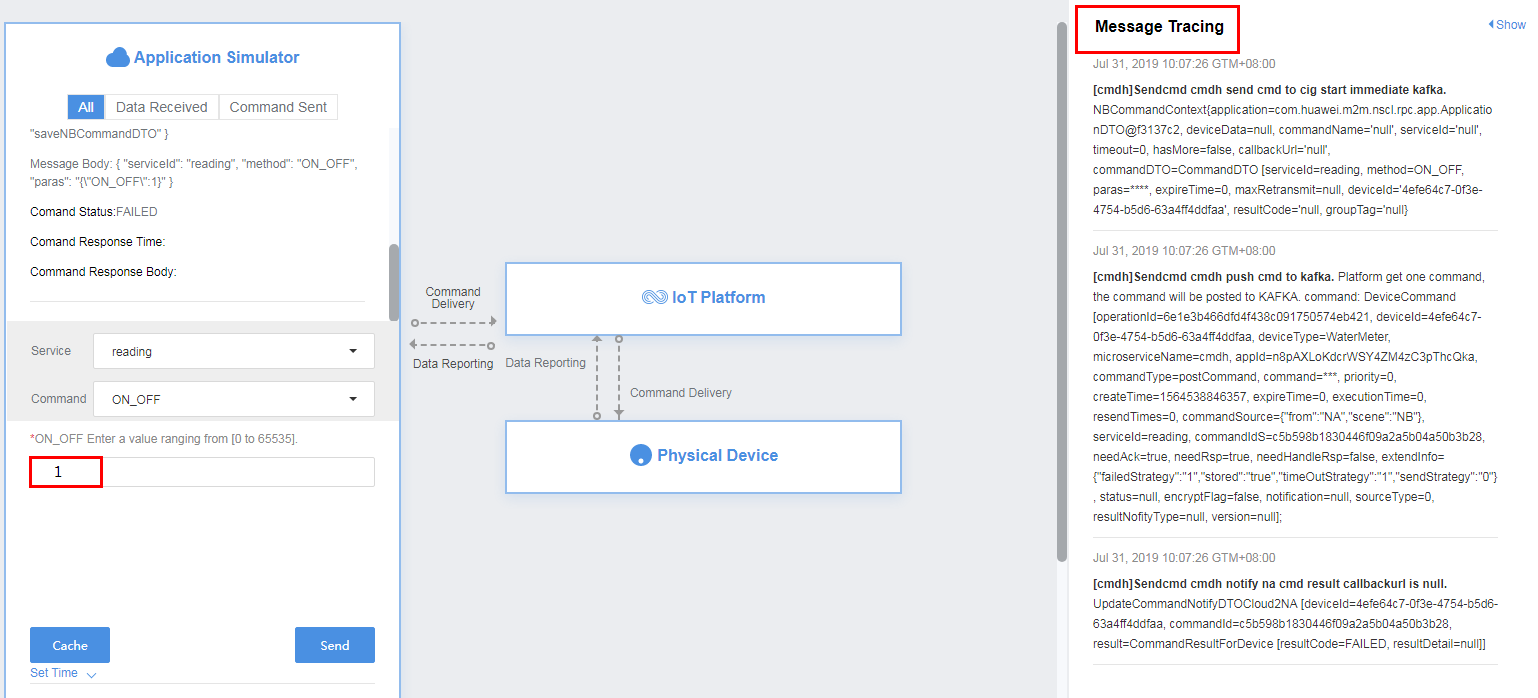
Deliver a command in Application Simulator. View processing logs of the IoT platform in Message Tracing and check the received command on the device.
- In the device list, click Test Application at the row where the newly added device resides to test the application.
Connect the device to the IoT platform and report data. View the data reporting result in IoT Platform and Application Simulator and processing logs of the IoT platform in Message Tracing.
Connect the NA to the IoT platform and deliver a command. View the command delivery result in IoT Platform and on the device and processing logs of the IoT platform in Message Tracing.

- In the device list, click the newly added device. On the page displayed, you can view device information, historical data, logs, and historical commands.
Adding a Virtual Device
- Choose and click Add Virtual Device.
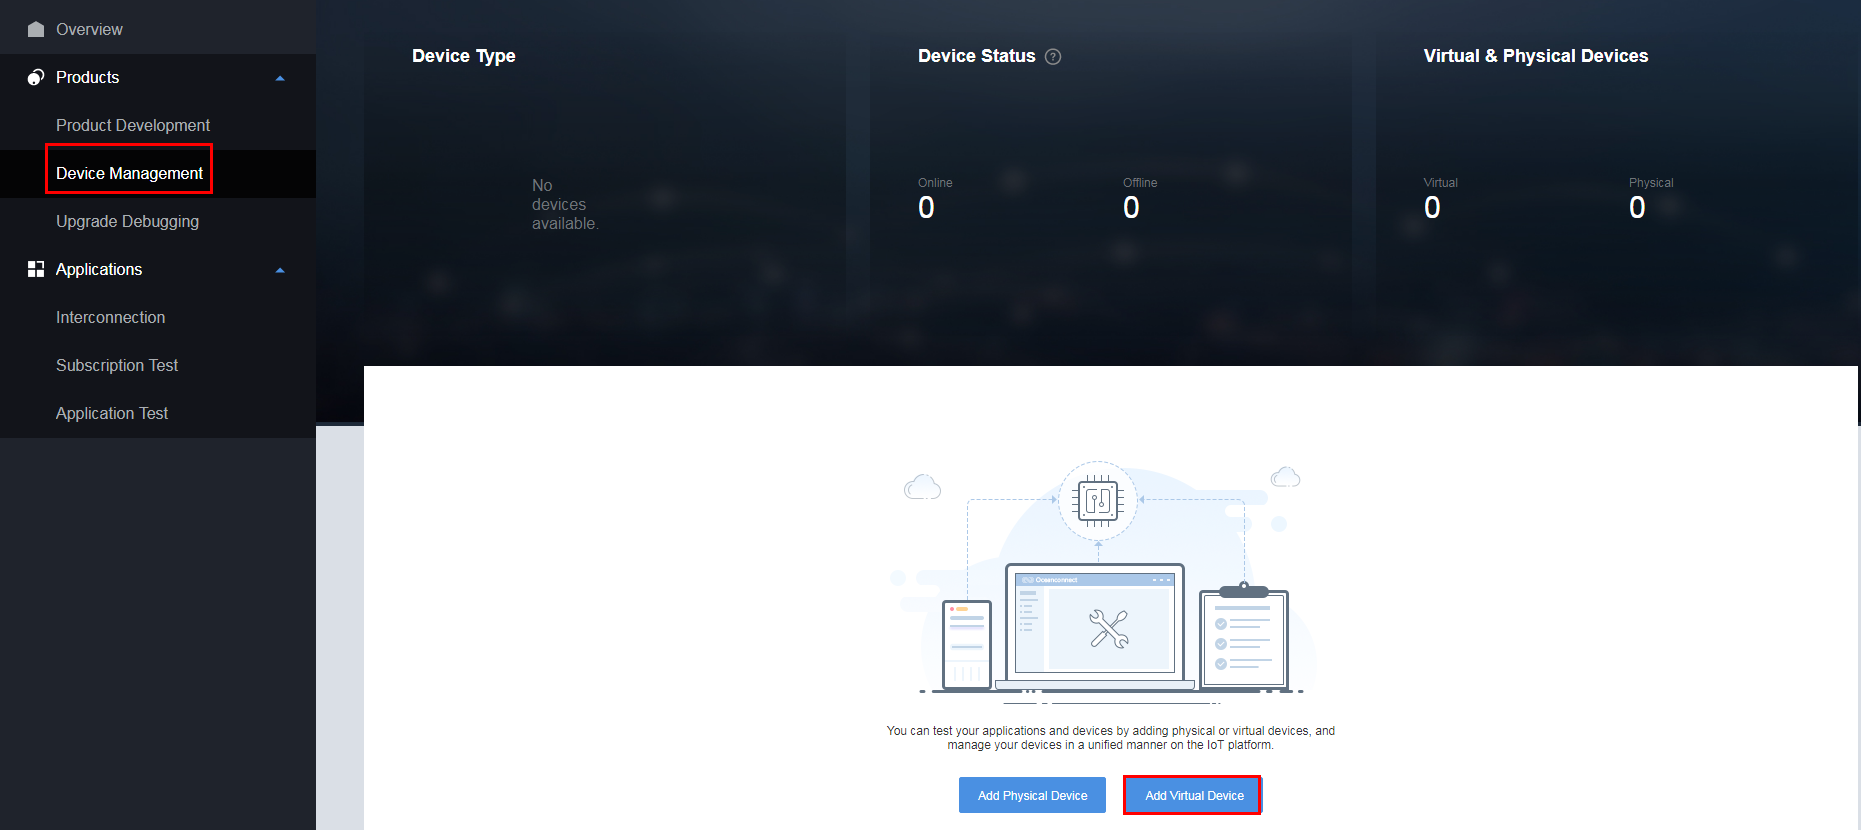
- In the Add Virtual Device dialog box displayed, select a device.
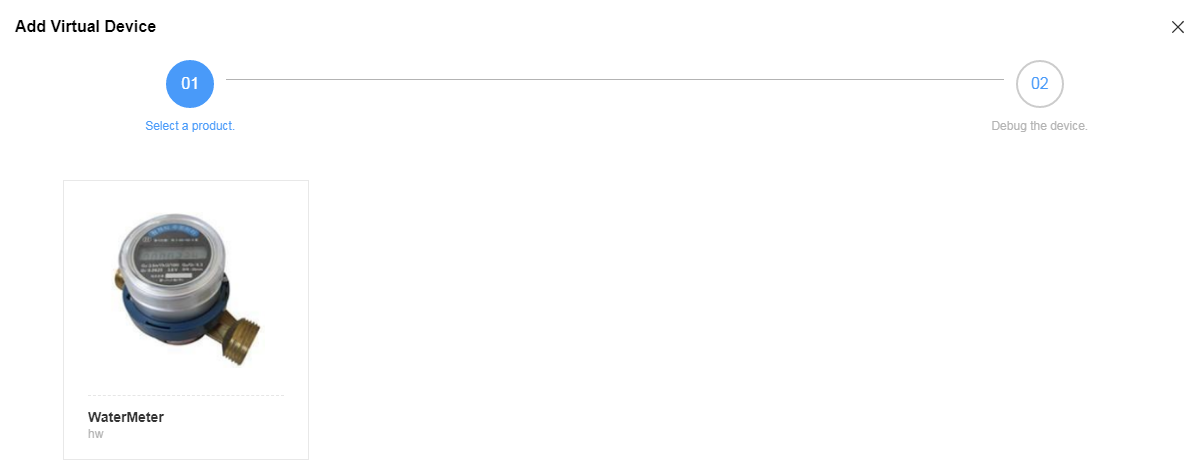
- After a virtual device is added, you can view details and perform testing on the device and the application.

- In the device list, click the newly added device. On the page displayed, you can view device information, historical data, logs, and historical commands.
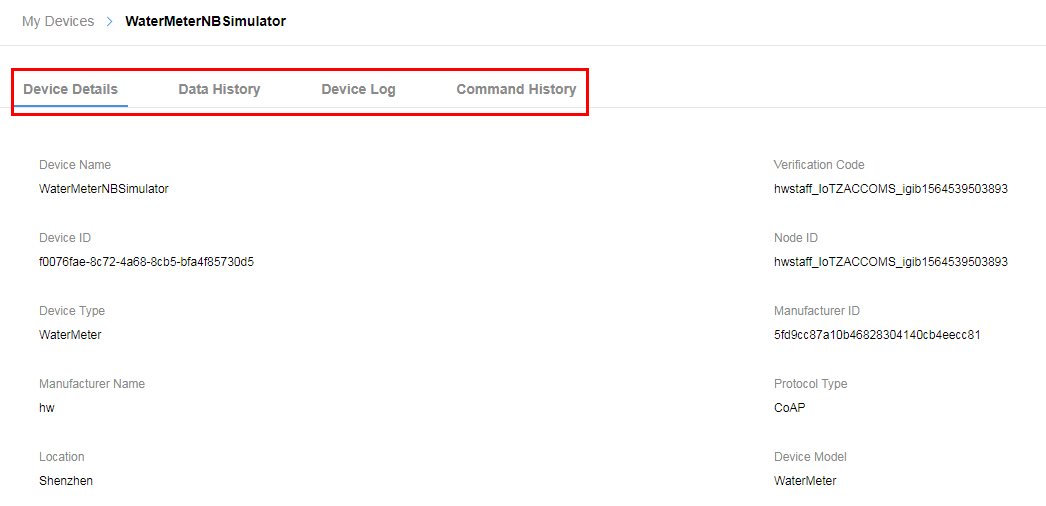
- In the device list, click Test Product at the row where the newly added device resides to test the product.
In Device Simulator, enter a hexadecimal code stream or JSON data (for example, enter a hexadecimal code stream) and click Send. Then, view the data reporting result in Application Simulator and processing logs of the IoT platform in Message Tracing.
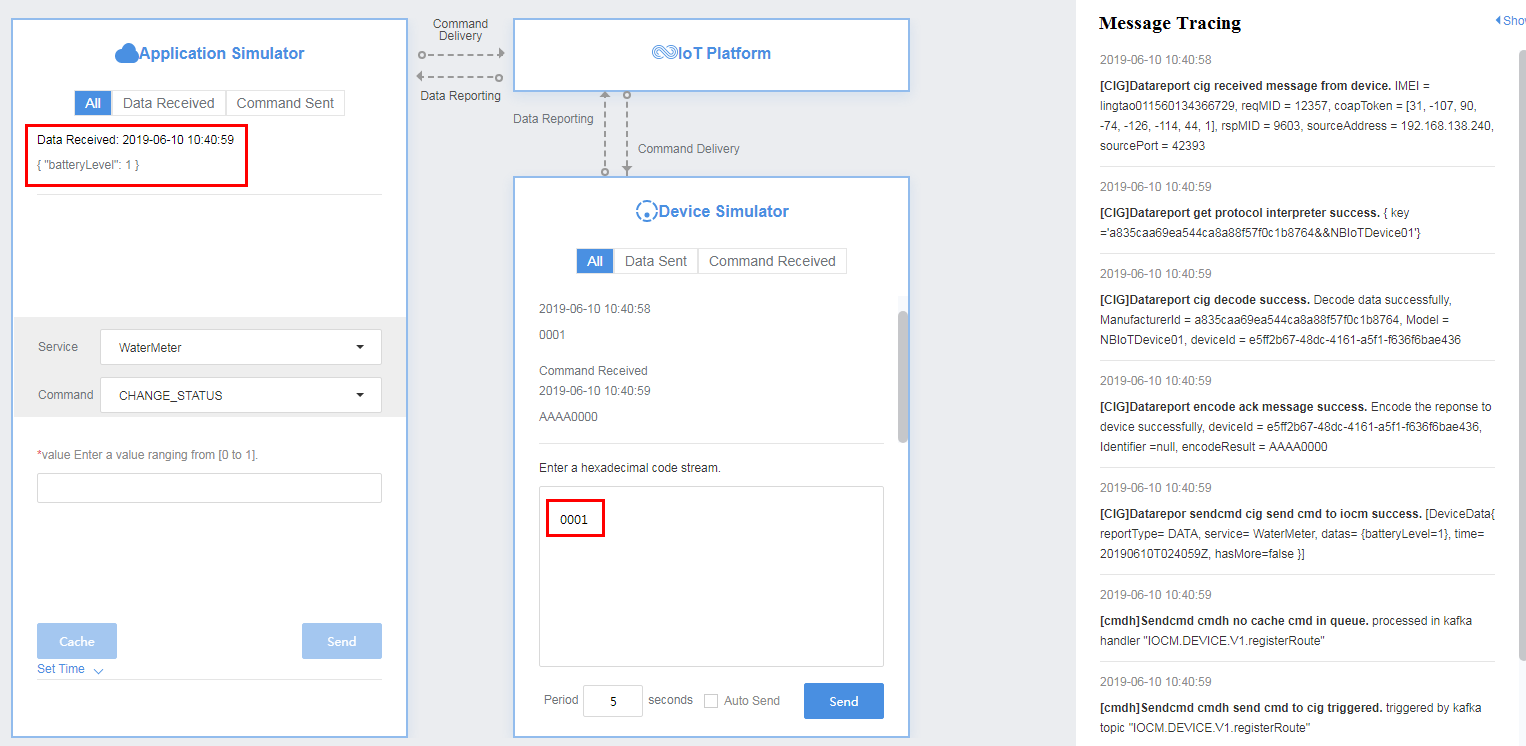
Deliver a command in Application Simulator. View the received command (for example, a hexadecimal code stream) in Device Simulator and processing logs of the IoT platform in Message Tracing.
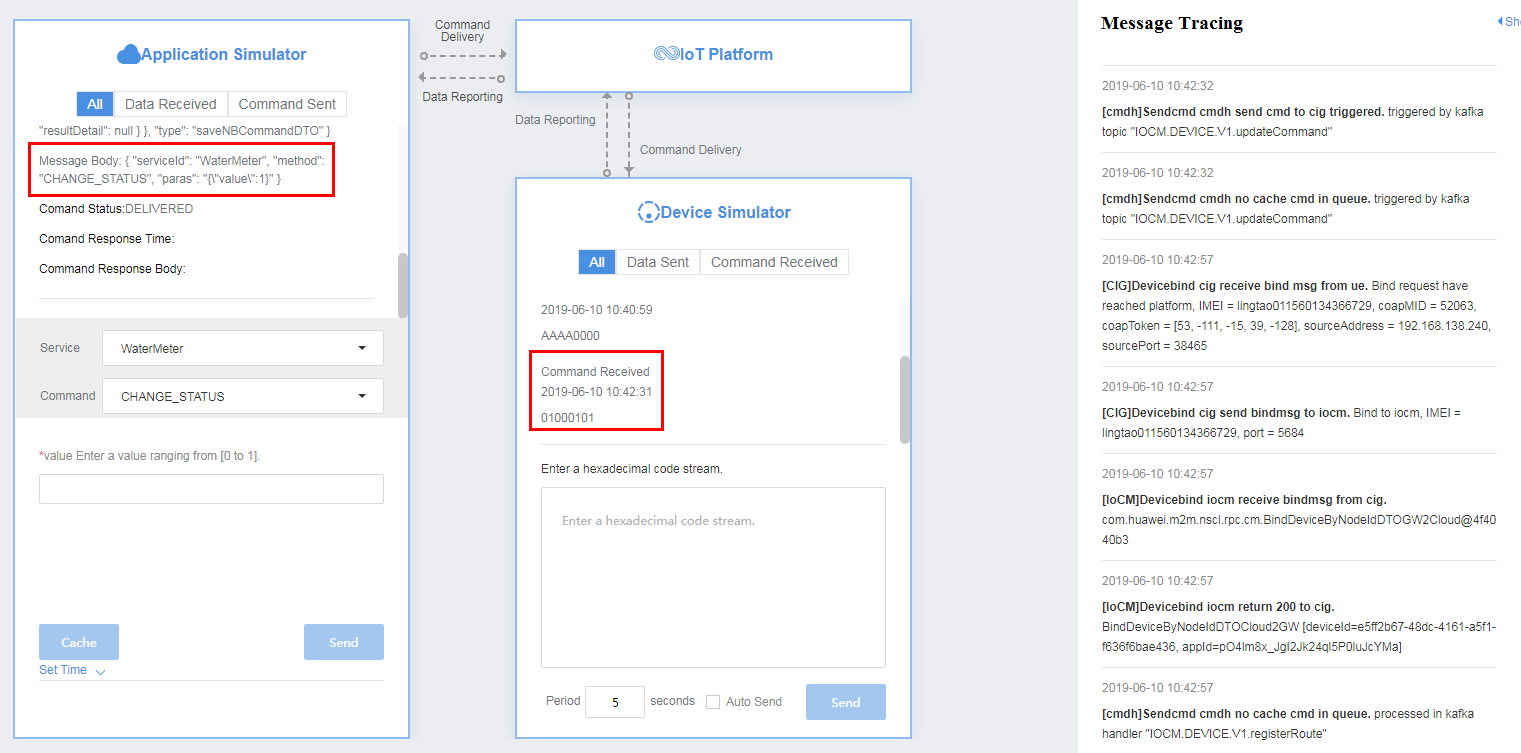
- In the device list, click Test Application at the row where the newly added device resides to test the application.
In Device Simulator, enter a hexadecimal code stream or JSON data (for example, enter a hexadecimal code stream) and click Send. Then, view the data reporting result in IoT Platform and Application Simulator and processing logs of the IoT platform in Message Tracing.
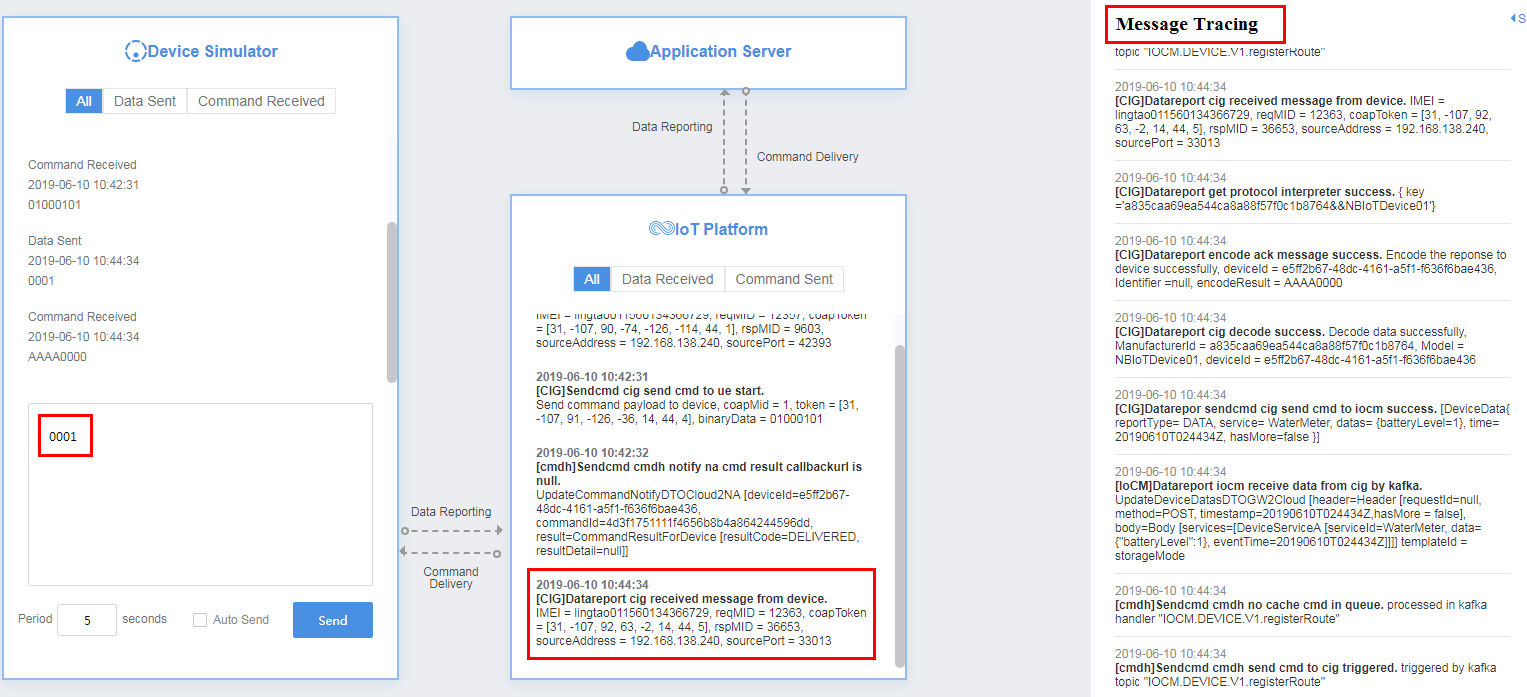
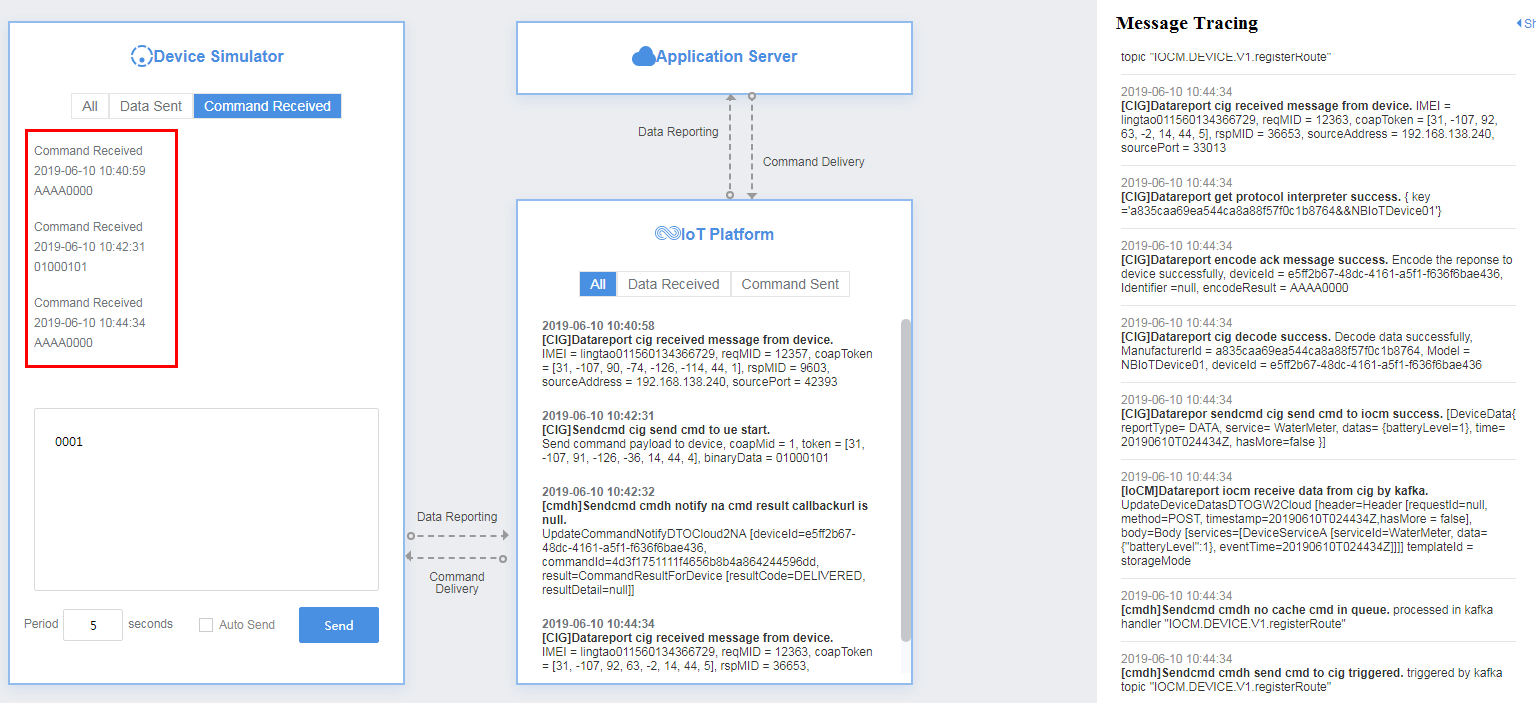
After the NA delivers a command, view the received command (for example, a hexadecimal code stream) in Device Simulator and view processing logs of the IoT platform in Message Tracing.
- In the device list, click the newly added device. On the page displayed, you can view device information, historical data, logs, and historical commands.
Feedback
Was this page helpful?
Provide feedbackThank you very much for your feedback. We will continue working to improve the documentation.See the reply and handling status in My Cloud VOC.
For any further questions, feel free to contact us through the chatbot.
Chatbot


