
How Can I Query Monitoring Data of Multiple Metrics?
FAQ Before API Calling
- Issue 1
How can I call the POST /V1.0/{project_id}/batch-query-metric-data API?
Solution
Rectify the fault by following the instructions provided in Querying Monitoring Data of Multiple Metrics.
- Issue 2
What is the maximum query time range supported when I call the POST /V1.0/{project_id}/batch-query-metric-data API?
Solution
The maximum query range is 155 days.
- Issue 3
What are the domain names for calling this API in different regions?
Solution
For details, see Regions and Endpoints.
FAQ During API Calling
- Issue 1
The response status code is 200 and no metric data is returned. Example response:
{
	"metrics": [{
		"namespace": "SYS.RDS",
		"metric_name": "rds039_disk_util",
		"dimensions": [{
			"name": "instance_id",
			"value": "5e319882ffa04c968e469035a116b2d1in04"
		}],
		"datapoints": [],##No metric data is displayed in the data points.
		"unit": "unknown"
	}]
}
Possible causes
- Cause 1: The namespace of the cloud service is incorrect. For details, see Case 1.
- Cause 2: The requested resource cannot be found. For details, see Case 2.
- Cause 2: The dimension is not applicable to the cloud service. For details, see Case 3.
- Cause 3: The metric ID is not applicable to the cloud service. For details, see Case 4.
Solution
For details about the namespaces, dimensions, and metrics, see Services Interconnected with Cloud Eye.
Case 1 : The namespace of the cloud service is incorrect.
The namespace corresponding to the metric mem_usedPercent is AGT.ECS.
Request parameters
{
	"from": 1724311893283,
	"to": 1724315493283,
	"period": "1",
	"filter": "average",
	"metrics": [{
		"dimensions": [{
			"name": "instance_id",
			"value": "129718f5-833d-4f78-b685-6b1c3091ea6"
		}],
		"metric_name": "mem_usedPercent",
		"namespace": "SYS.ECS"  ##Incorrect namespace
	}]
}
Response parameters
{
	"metrics": [{
		"namespace": "SYS.ECS",
		"metric_name": "mem_usedPercent",
		"dimensions": [{
			"name": "instance_id",
			"value": "129718f5-833d-4f78-b685-6b1c3091ea6"
		}],
		"datapoints": [],
		"unit": "unknown"
	}]
}
Case 2 : The requested resource cannot be found.
The instance 129718f5-833d-4f78-b685-6b1c3091ea7 is not in the ECS list.
Request parameters
{
	"from": 1724311893283,
	"to": 1724315493283,
	"period": "1",
	"filter": "average",
	"metrics": [{
		"dimensions": [{
			"name": "instance_id",
			"value": "129718f5-833d-4f78-b685-6b1c3091ea7"  ##129718f5-833d-4f78-b685-6b1c3091ea7 is not in the ECS list.
		}],
		"metric_name": "mem_usedPercent",
		"namespace": "AGT.ECS"
	}]
}
Response parameters
{
	"metrics": [{
		"namespace": "AGT.ECS",
		"metric_name": "mem_usedPercent",
		"dimensions": [{
			"name": "instance_id",
			"value": "129718f5-833d-4f78-b685-6b1c3091ea6"
		}],
		"datapoints": [],
		"unit": "unknown"
	}]
}
Case 3: The dimension is not applicable to the cloud service.
instance_id is not a dimension of RDS.
Request parameters
{
	"metrics": [{
		"dimensions": [{
			"name": "instance_id", ##instance_id is not a dimension of RDS.
			"value": "5e319882ffa04c968e469035a116b2d1in04"
		}],
		"metric_name": "rds039_disk_util",
		"namespace": "SYS.RDS"
	}],
	"filter": "average",
	"period": "1",
	"from": 1724312777938,
	"to": 1724316377938
}
Response parameters
{
	"metrics": [{
		"namespace": "SYS.RDS",
		"metric_name": "rds039_disk_util",
		"dimensions": [{
			"name": "instance_id",
			"value": "5e319882ffa04c968e469035a116b2d1in04"
		}],
		"datapoints": [],
		"unit": "unknown"
	}]
}
Case 4: The metric ID is not applicable to the cloud service.
The rds958_disk_util metric ID is not applicable to RDS.
Request parameters
{
	"metrics": [{
		"dimensions": [{
			"name": "rds_cluster_sqlserver_id",
			"value": "5e319882ffa04c968e469035a116b2d1in04"
		}],
		"metric_name": "rds958_disk_util",   ##The rds958_disk_util metric ID is not applicable to RDS.
		"namespace": "SYS.RDS"
	}],
	"filter": "average",
	"period": "1",
	"from": 1724312777938,
	"to": 1724316377938
}
Response parameters
{ "metrics": [{ "namespace": "SYS.RDS", "metric_name": "rds958_disk_util", "dimensions": [{ "name": "rds_cluster_sqlserver_id", "value": "5e319882ffa04c968e469035a116b2d1in04" }], "datapoints": [], "unit": "unknown" }] } - Issue 2
The response status code is 200, and no data of the ECS disk usage is returned.
Example response:
{
	"metrics": [{
		"namespace": "AGT.ECS",
		"metric_name": "disk_usedPercent",
		"dimensions": [{
			"name": "disk",
			"value": "012bec14bc176310c19f40e384fd629b"
		}, {
			"name": "instance_id",
			"value": "07d878a9-2243-4e84-aeef-c47747d18024"
		}],
		"datapoints": [],  ##No metric data is displayed in the metric data list.
		"unit": "unknown"
	}]
}
Possible causes
Cause 1: The namespace is incorrect. For details, see Case 1.
Cause 2: The metric dimension is incorrect. For details, see Case 2.
Cause 3: The Agent is not installed on the ECS. For details, see Case 3.
Cause 4: The Agent installed on the ECS does not report the disk usage. For details, see Case 4.
Case 1: incorrect namespace
If the OS monitoring metrics of an ECS are queried, the namespace must be AGT.ECS.
Request parameters
{
	"from": 1724118017498,
	"to": 1724121617498,
	"period": "1",
	"filter": "average",
	"metrics": [{
		"dimensions": [{
			"name": "instance_id",
			"value": "07d878a9-2243-4e84-aeef-c47747d18024"
		}, {
			"name": "mount_point",
			"value": "012bec14bc176310c19f40e384fd629b"
		}],
		"metric_name": "disk_usedPercent",
		"namespace": "SYS.ECS"  ##Incorrect namespace
	}]
}
Response parameters
{
	"metrics": [{
		"namespace": "SYS.ECS",
		"metric_name": "disk_usedPercent",
		"dimensions": [{
			"name": "mount_point",
			"value": "012bec14bc176310c19f40e384fd629b"
		}, {
			"name": "instance_id",
			"value": "07d878a9-2243-4e84-aeef-c47747d18024"
		}],
		"datapoints": [],
		"unit": "unknown"
	}]
}
Case 2: incorrect metric dimension
The disk usage is queried by mount point. Two dimensions: instance_id and mount_point are required in the request parameters for querying the disk usage.
Request parameters
{
	"from": 1724118017498,
	"to": 1724121617498,
	"period": "1",
	"filter": "average",
	"metrics": [{
		"dimensions": [{
			"name": "instance_id",
			"value": "07d878a9-2243-4e84-aeef-c47747d18024"
		}, {
			"name": "disk," ## Incorrect metric dimension
			"value": "012bec14bc176310c19f40e384fd629b"
		}],
		"metric_name": "disk_usedPercent",
		"namespace": "AGT.ECS"
	}]
}
Response parameters
{
	"metrics": [{
		"namespace": "AGT.ECS",
		"metric_name": "disk_usedPercent",
		"dimensions": [{
			"name": "disk",
			"value": "012bec14bc176310c19f40e384fd629b"
		}, {
			"name": "instance_id",
			"value": "07d878a9-2243-4e84-aeef-c47747d18024"
		}],
		"datapoints": [],
		"unit": "unknown"
	}]
}
Case 3: The Agent is not installed on an ECS.
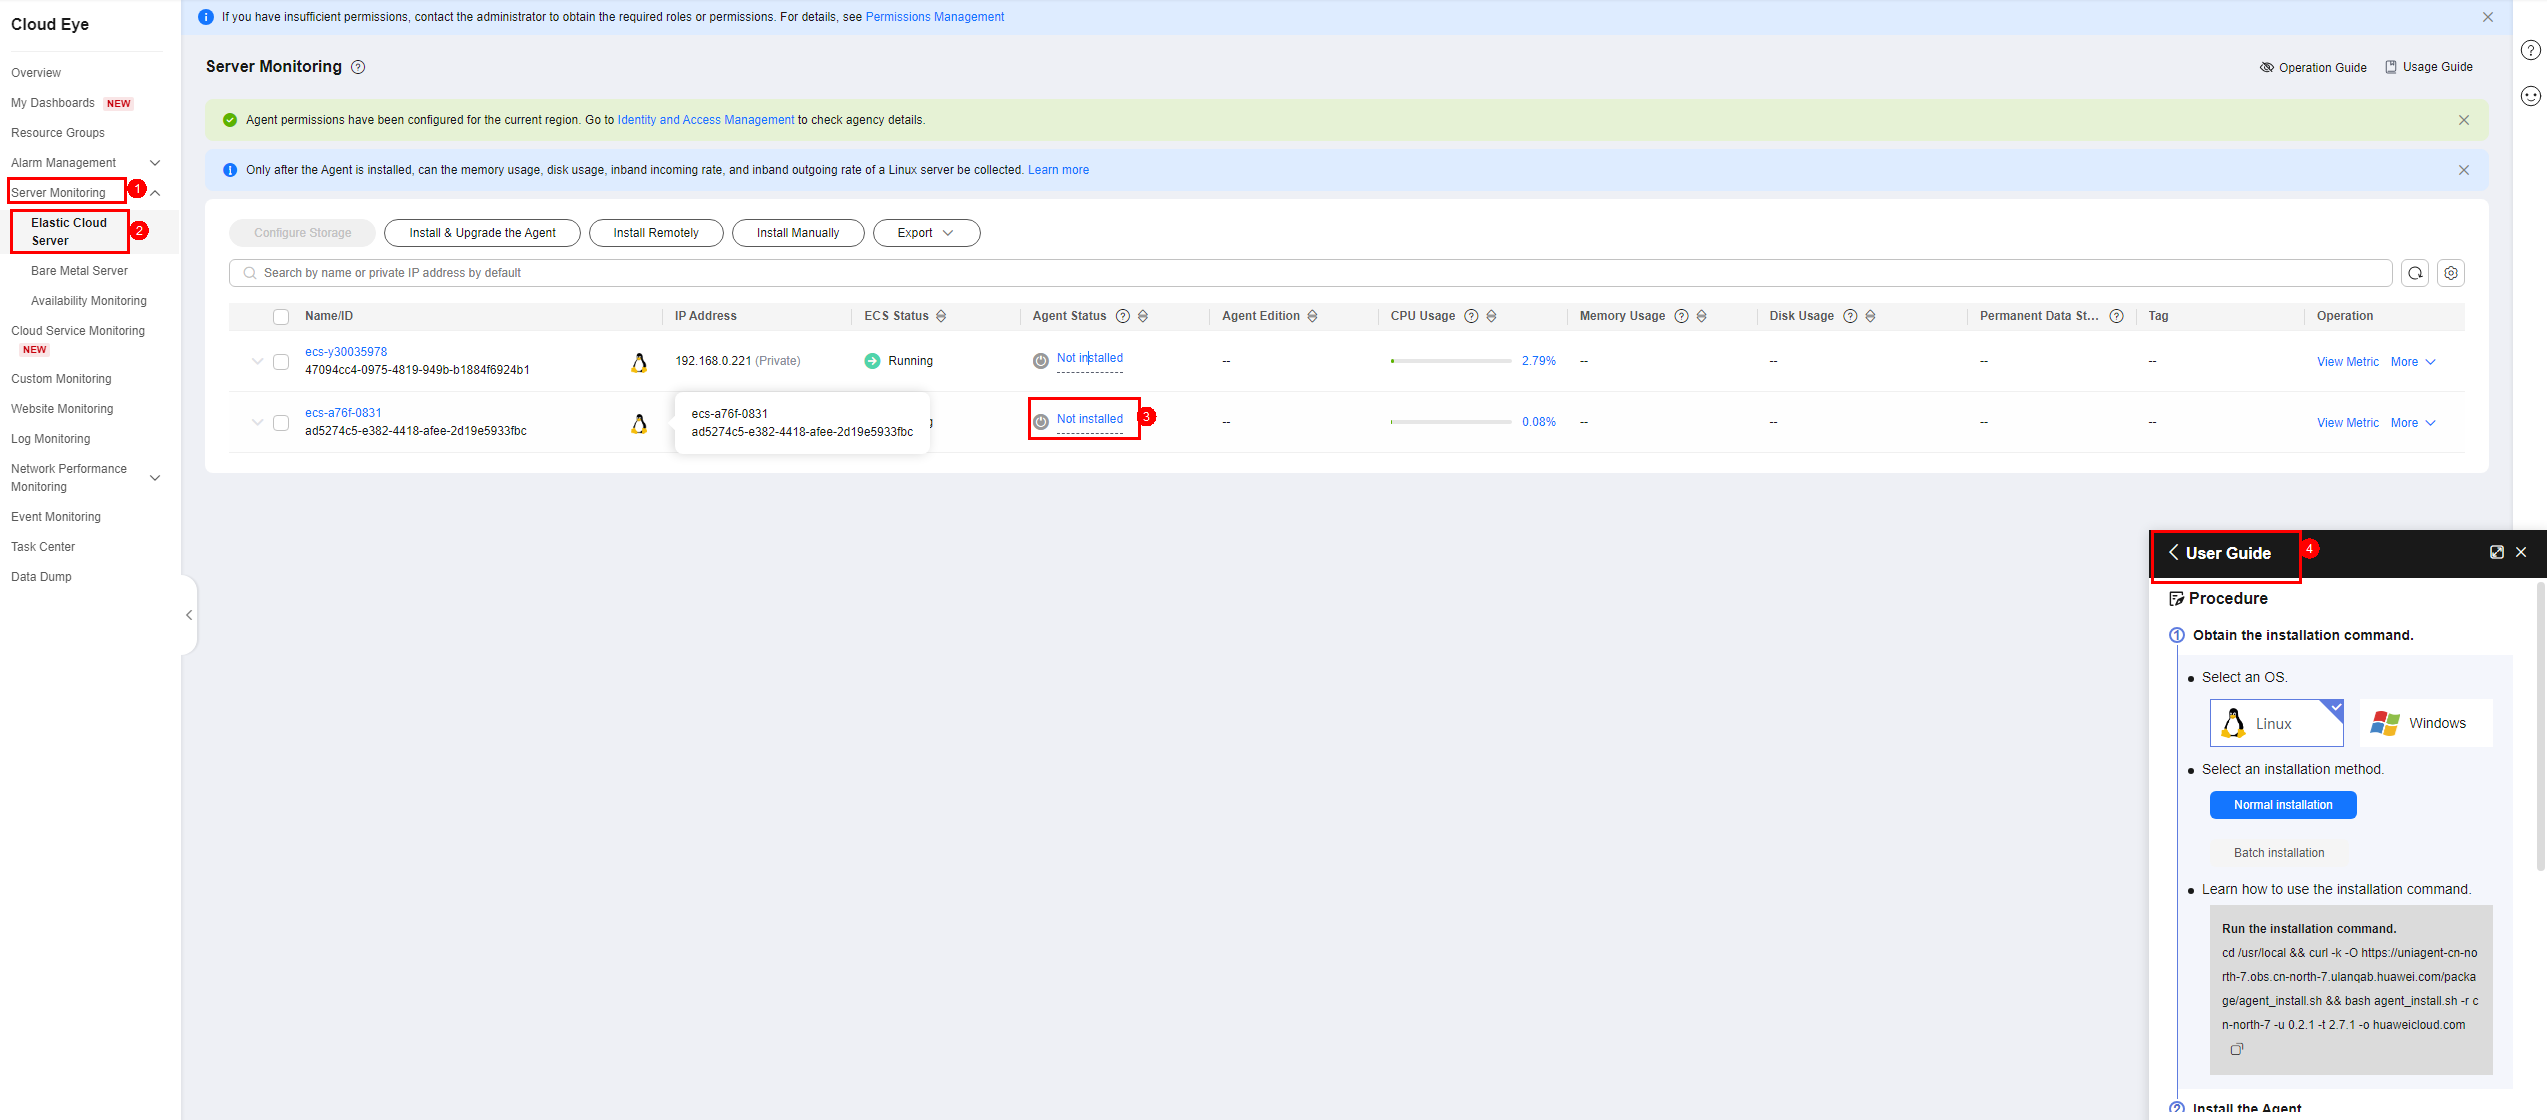
On the Cloud Eye console, choose Server Monitoring > Elastic Cloud Server in the navigation pane. Locate the ECS and click Not installed in the Agent Status column. Then install the Agent as instructed.
Case 4: The Agent installed on the ECS does not report the disk usage.
The Agent is faulty, so there is no metric data reported. For details, see Troubleshooting Common Agent Issues.
- Issue 3
The number of metric data records reported within a specified time range is greater than 3,000. However, the number of returned metric data records is less than 3,000 when the current API is called.
Possible causes
The default maximum query interval (to–from) varies depending on period and the number of metrics to be queried. The rule is as follows: The number of metrics × (to - from)/Monitoring interval ≤ 3000.

- The number of metrics: the number of elements in the metrics attribute, a request parameter
- Monitoring period: value of the period attribute in the request. The unit is minute by default and needs to be converted into milliseconds.
- 3000: the total number of all data points (the metric data list) in the response body
Cause 1: If the metric reporting period is shorter than the monitoring period for querying monitoring data of multiple metrics, multiple metrics reported during the monitoring period are aggregated into a point based on the aggregation rule. As a result, the queried metric data volume is less than the reported data volume.
Cause 2: If the metric reporting period is the same as the monitoring period for querying monitoring data of multiple metrics, a maximum of 3,000 metric data records can be returned according to the preceding calculation rule.
Solution
- Set the monitoring period in the request parameters to a smaller value based on the enumerated values provided in the API reference.
- Use the API for querying monitoring data of a single metric. This API has no limit on the number of returned metric data records.
- Issue 4
When the API for querying monitoring data of multiple metrics is called, the time taken for returning the metric data points is much greater than the value of the from parameter in the request.
Possible causes
The default maximum query interval (to–from) varies depending on period and the number of metrics to be queried. The rule is as follows: The number of metrics × (to - from)/Monitoring interval ≤ 3000.
- The number of metrics: the number of elements in the metrics attribute, a request parameter
- Monitoring period: value of the period attribute in the request. The unit is minute by default and needs to be converted into milliseconds.
- 3000: the total number of all data points (the metric data list) in the response body
For example, if 300 metrics are queried in batches and the monitoring interval is 60,000 ms, the maximum value of (to-from) is 600000. If (to-from) exceeds 600,000, from is automatically changed to to-600000.
Cause 1: According to the preceding formula, the number of metrics is too large. For details, see Case 1.
Cause 2: According to the preceding formula, the monitoring period is too short. For details, see Case 1.
Solution
Cause 1: There are too many metrics.
Solution: Reduce the number of metrics.
Use the API for querying monitoring data to query a single metric.
Cause 2: A small enumerated value for the monitoring period is selected.
Solution: Set the monitoring period in the request parameter to a large enumerated value provided in the API reference.
Case 1: too many metrics and short monitoring period
If the number of requested metrics is 300 and the monitoring period is 1 minute, the maximum value of (to - from) is 600000. If the value of the request parameter (to – from) is 3600000 (1724742027556 – 1724738427556), which exceeds the value of 600000, the value of from is automatically changed to "to – 600000", that is, 1724742027556 – 600000 = 1724741427556.
The earliest metric data point returned by the API within the specified time range is 2024-08-27 14:51:27, but the query start time is 2024-08-27 14:00:27.
Request parameters
{
  "metrics": [
    {
      "dimensions": [
        {
          "name": "disk_name",
          "value": "6a2bf14a-e3be-4fc9-8522-ba6fe7f0b503-vda"
        }
      ],
      "metric_name": "disk_device_read_bytes_rate",
      "namespace": "SYS.EVS"
    },
    {
      "dimensions": [
        {
          "name": "disk_name",
          "value": "6a2bf14a-e3be-4fc9-8522-ba6fe7f0b503-vdc"
        }
      ],
      "metric_name": "disk_device_read_bytes_rate",
      "namespace": "SYS.EVS"
    },
    {
      "dimensions": [
        {
          "name": "disk_name",
          "value": "6a2bf14a-e3be-4fc9-8522-ba6fe7f0b503-vda"
        }
      ],
      "metric_name": "disk_device_write_bytes_rate",
      "namespace": "SYS.EVS"
    },
    {
      "dimensions": [
        {
          "name": "disk_name",
          "value": "6a2bf14a-e3be-4fc9-8522-ba6fe7f0b503-vdc"
        }
      ],
      "metric_name": "disk_device_write_bytes_rate",
      "namespace": "SYS.EVS"
    },
    ......
    {
      "dimensions": [
        {
          "name": "nat_gateway_id",
          "value": "3c55363f-6416-45ca-8512-cf1f6f2533e7"
        }
      ],
      "metric_name": "inbound_pps",
      "namespace": "SYS.NAT"
    }
  ],
  "filter": "max",
  "period": "1",
  "from": 1724738427556, ##2024-08-27 14:00:27
  "to": 1724742027556 ##2024-08-27 15:00:27
}
Response parameters
{
    "metrics": [
        {
            "namespace": "SYS.EVS",
            "metric_name": "disk_device_read_bytes_rate",
            "dimensions": [
                {
                    "name": "disk_name",
                    "value": "6a2bf14a-e3be-4fc9-8522-ba6fe7f0b503-vda"
                }
            ],
            "datapoints": [
                {
                    "max": 0,
                    "timestamp": 1724741487000  ##2024-08-27 14:51:27
                },
                {
                    "max": 0,
                    "timestamp": 1724741547000  ##2024-08-27 14:52:27
                },
                {
                    "max": 0,
                    "timestamp": 1724741607000
                },
                {
                    "max": 0,
                    "timestamp": 1724741667000
                },
                {
                    "max": 0,
                    "timestamp": 1724741727000
                },
				......
            ],
            "unit": "B/s"
        },
        {
            "namespace": "SYS.EVS",
            "metric_name": "disk_device_read_bytes_rate",
            "dimensions": [
                {
                    "name": "disk_name",
                    "value": "6a2bf14a-e3be-4fc9-8522-ba6fe7f0b503-vdc"
                }
            ],
            "datapoints": [
                {
                    "max": 0,
                    "timestamp": 1724741487000
                },
                {
                    "max": 0,
                    "timestamp": 1724741547000
                },
                {
                    "max": 0,
                    "timestamp": 1724741607000
                },
                {
                    "max": 0,
                    "timestamp": 1724741667000
                },
                {
                    "max": 0,
                    "timestamp": 1724741727000
                },
                 ......
            ],
            "unit": "B/s"
        },
        {
            "namespace": "SYS.EVS",
            "metric_name": "disk_device_write_bytes_rate",
            "dimensions": [
                {
                    "name": "disk_name",
                    "value": "6a2bf14a-e3be-4fc9-8522-ba6fe7f0b503-vda"
                }
            ],
            "datapoints": [
                {
                    "max": 3055.1,
                    "timestamp": 1724741487000
                },
                {
                    "max": 3195.78,
                    "timestamp": 1724741547000
                },
                {
                    "max": 2973.39,
                    "timestamp": 1724741607000
                },
                {
                    "max": 3533.52,
                    "timestamp": 1724741667000
                },
                {
                    "max": 2636.8,
                    "timestamp": 1724741727000
                },
                 .......
            ],
            "unit": "B/s"
        },
        ......
    ]
}
Troubleshooting Common 4XX Issues
- HTTP status code
400
Error code
ces.0014
Possible causes
Cause 1: The request parameter format is incorrect. For details, see Case 1.
Cause 2: Mandatory fields are not transferred. For details, see Case 2.
Case 1: incorrect request parameter format
- The values of the from and to attributes must be converted into millisecond.
- The period attribute supports the following enumerated values: 1300, 1200, 3600, 14400, and 86400.
- The filter attribute supports the following enumerated values: average, max, min, sum, and variance.
Request parameters
{
	"from": 1724331974,   ## The input parameter is in seconds instead of milliseconds.
	"to": 1724315493,     ##The input parameter is in seconds instead of milliseconds.
	"period": "10086",    ##Invalid period value
	"filter": "standard", ##Invalid filter value
	"metrics": [{
		"dimensions": [{
			"name": "instance_id",
			"value": "129718f5-833d-4f78-b685-6b1c3091ea69"
		}],
		"metric_name": "mem_usedPercent",
		"namespace": "AGT.ECS"
	}]
}
Response parameters
{
	"http_code": 400,
	"message": {
		"details": "Some content in message body is not correct, error message: [from, to]",##from and to issues
		"code": "ces.0014"
	},
	"encoded_authorization_message": null
}
Case 2: Mandatory fields are not transferred.
The mandatory field filter is not transferred. For more mandatory fields, see the API reference.
Request parameters
{
	"from": 1724119607020,
	"to": 1724123207020,
	"period": "1",
	"metrics": [{
		"dimensions": [{
			"name": "instance_id",
			"value": "238764d4-c4e1-4274-88a1-5956b057766b"
		}],
		"metric_name": "mem_usedPercent",
		"namespace": "AGT.ECS"
	}]
}
Response parameters
{
	"http_code": 400,
	"message": {
		"details": "Some content in message body is not correct, error message: [filter]",  ##filter issues
		"code": "ces.0014"
	},
	"encoded_authorization_message": null
}
- HTTP status code
404
Error code
APIGW.0101
Possible causes
Cause 1: The path URI is inconsistent with that in the API reference. For details, see Case 1.
Case 1: The URI of the path is inconsistent with that in the API reference.
The version in the URI in the request path is incorrect. The correct version is V1.0 instead of V1. The correct URI is /V1.0/{project_id}/batch-query-metric-data.
Request path
POST /V1/04f9aca88c00d3202fd4c01ed679daf0/batch-query-metric-data
Response parameters
{ "error_code": "APIGW.0101", "error_msg": "The API does not exist or has not been published in the environment", "request_id": "7d7a8258354300ac158c7b14a158d6ec" } - HTTP status code
401
Error code
ces.0015
Possible causes
Cause 1: The project ID in the request for obtaining the token from IAM is different from the project ID used for calling the API for querying monitoring data of multiple metrics.
Cause 2: The token has expired.
Cause 3: The token content is copied less or more.
Cause 4: The AK and SK do not match.
Troubleshooting
Rectify the fault based on the possible causes.
Solution
Cause 1: The project ID in the request for obtaining the token from IAM is different from the project ID used for calling the API for querying monitoring data of multiple metrics.
Solution: Ensure that the two project IDs are the same.
Cause 2: The token has expired.
Solution: Generate a new token.
Cause 3: The token content is copied less or more.
Solution: Obtain the correct token.
Cause 4: The AK and SK do not match.
Solution: Obtain the AK and SK of the tenant.
Case
The authentication fails due to a token exception.
Request header
X-Auth-Token: MIIqDgYJKoZIhvcNAQcCoIIp-zCC......+6CIyAFrbHVxQZJ2Jq ##Token is abnormal.
Request parameters
{
	"from": 1724311893283,
	"to": 1724315493283,
	"period": "1",
	"filter": "average",
	"metrics": [{
		"dimensions": [{
			"name": "instance_id",
			"value": "129718f5-833d-4f78-b685-6b1c3091ea69"
		}],
		"metric_name": "mem_usedPercent",
		"namespace": "AGT.ECS"
	}]
}
Response parameters
{ "http_code": 401, "message": { "details": "Authenticate failed.", "code": "ces.0015" }, "encoded_authorization_message": null } - HTTP status code
403
Error code
ces.0050
Possible causes
Possible cause 1: The user policy does not contain the ces:metricData:list permissions. For details, see Case 1.
Case 1: The user policy does not contain the ces:metricData:list fine-grained permissions.
Add the ces:metricData:list action to the policy to which the user belongs.
Request header
X-Auth-Token: MIIqDgYJKoZIhvcNAQcCoIIp-zCC......+6CIyAFrbHVxQZJ2Jq
Request parameters
{
	"from": 1724311893283,
	"to": 1724315493283,
	"period": "1",
	"filter": "average",
	"metrics": [{
		"dimensions": [{
			"name": "instance_id",
			"value": "129718f5-833d-4f78-b685-6b1c3091ea69"
		}],
		"metric_name": "mem_usedPercent",
		"namespace": "AGT.ECS"
	}]
}
Response parameters
{ "http_code": 403, "message": { "details": "Policy doesn't allow [ces:metricData:list] to be performed.", ## The user policy does not contain the ces:metricData:list fine-grained permissions. "code": "ces.0050" }, "encoded_authorization_message": null } - HTTP status code
429
Error code
ces.0429
Possible causes
Cause 1: The API is throttled. For details, see Case 1.
Case 1: The API is throttled.
The request API is throttled. If the API is throttled, contact O&M personnel to configure a new process policy immediately.
Request parameters
{
	"from": 1724311893283,
	"to": 1724315493283,
	"period": "1",
	"filter": "average",
	"metrics": [{
		"dimensions": [{
			"name": "instance_id",
			"value": "129718f5-833d-4f78-b685-6b1c3091ea69"
		}],
		"metric_name": "mem_usedPercent",
		"namespace": "AGT.ECS"
	}]
}
Response parameters
{
	"http_code": 429,
	"message": {
		"details": "Too Many Requests.",
		"code": "ces.0429"
	},
	"encoded_authorization_message": null
}
Feedback
Was this page helpful?
Provide feedbackThank you very much for your feedback. We will continue working to improve the documentation.See the reply and handling status in My Cloud VOC.
For any further questions, feel free to contact us through the chatbot.
Chatbot


