

Viewing the Web Security Overview
On the Dashboard page, you can view the protection logs of all protected websites or instances for a specified time range, including yesterday, today, past 3 days, past 7 days, or past 30 days. The protection statistics include the number of attacks of each type, top 5 attacked domain names, top 5 attack source IP addresses, and top 5 attacked URLs.
Statistics on the Web Security Overview page are updated every minute.

If you have enabled enterprise projects, you can select your enterprise project from the Enterprise Project drop-down list and view security statistics data of the project.
Prerequisites
- A domain name has been added and connected. For details, see Adding a Website to EdgeSec.
- At least one protection rule has been configured for the domain name.
Specification Limitations
On the Dashboard page, protection data of a maximum of 30 days can be viewed.
Procedure
- Log in to the EdgeSec console.
- In the navigation pane on the left, choose Dashboard under Edge Security. The Dashboard page is displayed.
- Select Enterprise project at the top of the page, set the domain name, website, and query time, and view the total number of requests, attacks and pages attacked by each type of attack.
- Domain Names: shows information about website domain names added to the EdgeSec instance in the selected enterprise project. Click View to go to the Website Settings page and view details about domain names of protected websites.
- All protected websites: By default, the information about all websites you add to EdgeSec in all enterprise projects are displayed.
- Query time: You can select Yesterday, Today, Past 3 days, Past 7 days, or Past 30 days.
- Auto Refresh: After the function is enabled, the data is refreshed every 30 seconds. Figure 1 Setting search criteria

- Requests: shows the page views of the website, making it easy for you to view the total number of pages accessed by visitors in a certain period of time.
- Attacks: shows how many times the website are attacked.
An alarm is generated when the number of attacks on a single domain name reaches 100,000 within 5 minutes. You can click Message Center button in the upper right corner of the console and choose to view detailed alarm information on the O&M tab page.
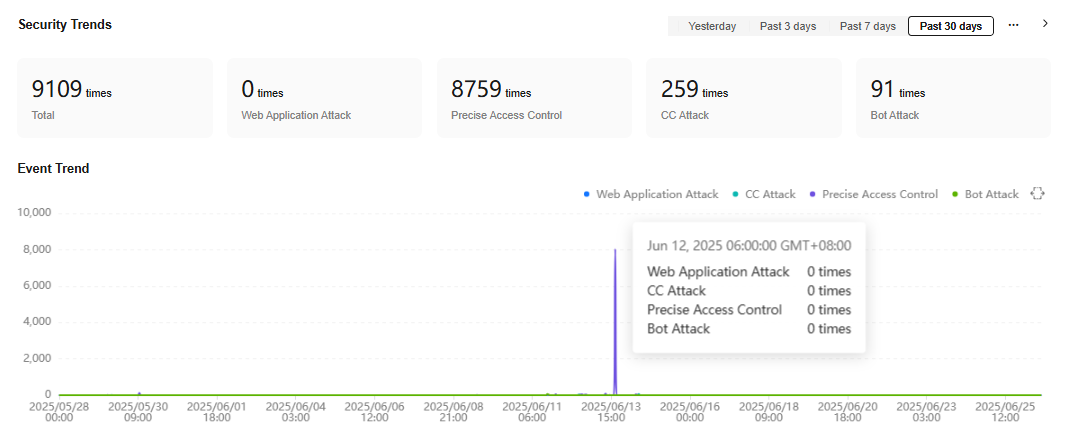
- You can view how many requests are attacked by a certain type of attacks within a certain period of time.
- Click the Horizontally Select icon
 on the right to select a time segment. This will zoom in and display detailed data for the specified period.
 - You can click Show Details to view the details of the 10 domain names with the most requests, attacks, and basic web protection, precise protection, CC attack protection, and anti-crawler protection actions.
Figure 2 Protection action statistics
What is your overall rating for this page?
Thank you very much for your feedback. We will continue working to improve the documentation.See the reply and handling status in My Cloud VOC.
For any further questions, feel free to contact us through the chatbot.
Chatbot


