El contenido no se encuentra disponible en el idioma seleccionado. Estamos trabajando continuamente para agregar más idiomas. Gracias por su apoyo.

Compute
Elastic Cloud Server
Huawei Cloud Flexus
Bare Metal Server
Auto Scaling
Image Management Service
Dedicated Host
FunctionGraph
Cloud Phone Host
Huawei Cloud EulerOS
Networking
Virtual Private Cloud
Elastic IP
Elastic Load Balance
NAT Gateway
Direct Connect
Virtual Private Network
VPC Endpoint
Cloud Connect
Enterprise Router
Enterprise Switch
Global Accelerator
Management & Governance
Cloud Eye
Identity and Access Management
Cloud Trace Service
Resource Formation Service
Tag Management Service
Log Tank Service
Config
OneAccess
Resource Access Manager
Simple Message Notification
Application Performance Management
Application Operations Management
Organizations
Optimization Advisor
IAM Identity Center
Cloud Operations Center
Resource Governance Center
Migration
Server Migration Service
Object Storage Migration Service
Cloud Data Migration
Migration Center
Cloud Ecosystem
KooGallery
Partner Center
User Support
My Account
Billing Center
Cost Center
Resource Center
Enterprise Management
Service Tickets
HUAWEI CLOUD (International) FAQs
ICP Filing
Support Plans
My Credentials
Customer Operation Capabilities
Partner Support Plans
Professional Services
Analytics
MapReduce Service
Data Lake Insight
CloudTable Service
Cloud Search Service
Data Lake Visualization
Data Ingestion Service
GaussDB(DWS)
DataArts Studio
Data Lake Factory
DataArts Lake Formation
IoT
IoT Device Access
Others
Product Pricing Details
System Permissions
Console Quick Start
Common FAQs
Instructions for Associating with a HUAWEI CLOUD Partner
Message Center
Security & Compliance
Security Technologies and Applications
Web Application Firewall
Host Security Service
Cloud Firewall
SecMaster
Anti-DDoS Service
Data Encryption Workshop
Database Security Service
Cloud Bastion Host
Data Security Center
Cloud Certificate Manager
Edge Security
Blockchain
Blockchain Service
Web3 Node Engine Service
Media Services
Media Processing Center
Video On Demand
Live
SparkRTC
MetaStudio
Storage
Object Storage Service
Elastic Volume Service
Cloud Backup and Recovery
Storage Disaster Recovery Service
Scalable File Service Turbo
Scalable File Service
Volume Backup Service
Cloud Server Backup Service
Data Express Service
Dedicated Distributed Storage Service
Containers
Cloud Container Engine
SoftWare Repository for Container
Application Service Mesh
Ubiquitous Cloud Native Service
Cloud Container Instance
Databases
Relational Database Service
Document Database Service
Data Admin Service
Data Replication Service
GeminiDB
GaussDB
Distributed Database Middleware
Database and Application Migration UGO
TaurusDB
Middleware
Distributed Cache Service
API Gateway
Distributed Message Service for Kafka
Distributed Message Service for RabbitMQ
Distributed Message Service for RocketMQ
Cloud Service Engine
Multi-Site High Availability Service
EventGrid
Dedicated Cloud
Dedicated Computing Cluster
Business Applications
Workspace
ROMA Connect
Message & SMS
Domain Name Service
Edge Data Center Management
Meeting
AI
Face Recognition Service
Graph Engine Service
Content Moderation
Image Recognition
Optical Character Recognition
ModelArts
ImageSearch
Conversational Bot Service
Speech Interaction Service
Huawei HiLens
Video Intelligent Analysis Service
Developer Tools
SDK Developer Guide
API Request Signing Guide
Terraform
Koo Command Line Interface
Content Delivery & Edge Computing
Content Delivery Network
Intelligent EdgeFabric
CloudPond
Intelligent EdgeCloud
Solutions
SAP Cloud
High Performance Computing
Developer Services
ServiceStage
CodeArts
CodeArts PerfTest
CodeArts Req
CodeArts Pipeline
CodeArts Build
CodeArts Deploy
CodeArts Artifact
CodeArts TestPlan
CodeArts Check
CodeArts Repo
Cloud Application Engine
MacroVerse aPaaS
KooMessage
KooPhone
KooDrive

Monitoring a Real-Time Job

Updated on 2022-02-22 GMT+08:00

You can view information such as the running status, start time, and end time of the real-time processing job on the Real-Time Job Monitoring page, and start and stop the real-time processing job.

Figure 1 Real-time job monitoring page
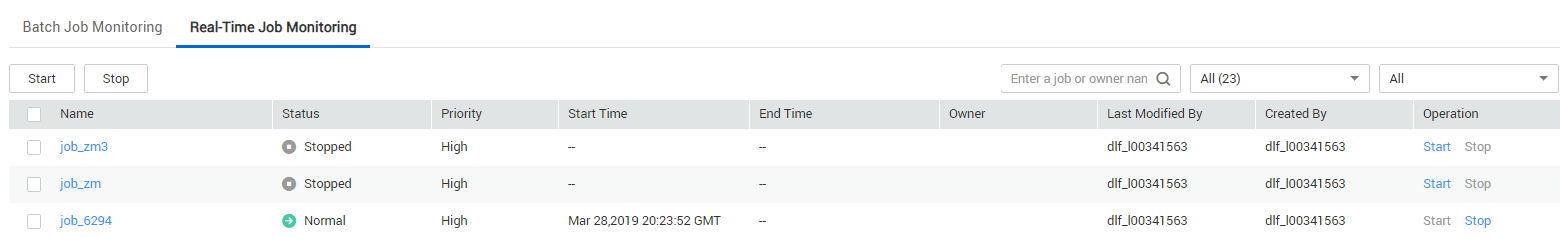
  • Batch processing jobs: Select jobs and click Start/Stop.
  • Viewing node information of the job: Click a job name. On the page that is displayed, view the node connection relationship and monitoring information.
  • Viewing status of the latest instances: Click the drop-down arrow next to the name of a job to view the latest instance status.

Real-Time Jobs: Configuring Event-based Scheduling on a Node

If event-driven scheduling is configured for a node in a real-time job, right-click the node and choose Configure Scheduling from the shortcut menu to view and modify the scheduling information about the node.

  1. Log in to the DLF console.
  2. In the navigation tree of the DLF console, choose Monitoring > Monitor Job.
  3. On the Real-Time Job Monitoring tab page, click a job name.
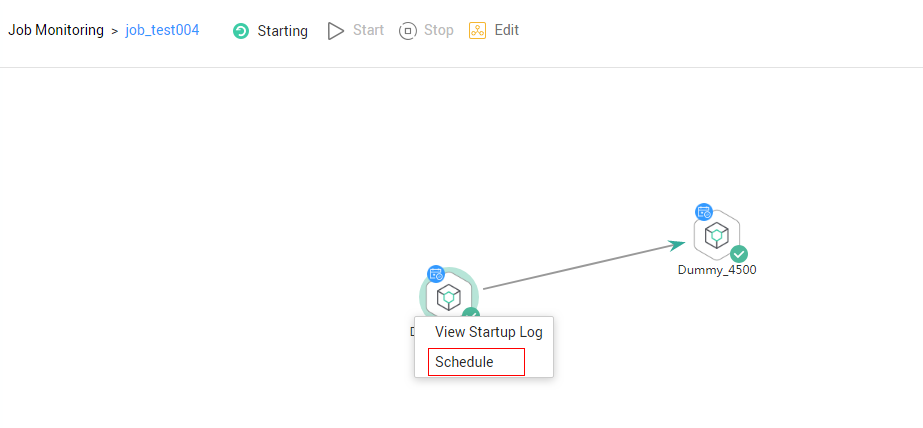
  4. Click the node where event-driven scheduling is configured and choose Configure Scheduling. Set the parameters described in Table 1.

    When you click View Startup Log, you can view the job startup log information.
    Figure 2 Configuring scheduling
    • When Triggering Event Type of Event-Driven Scheduling is set to DIS, configure a DIS scheduling policy as follows:
      Figure 3 Configuring a DIS scheduling policy
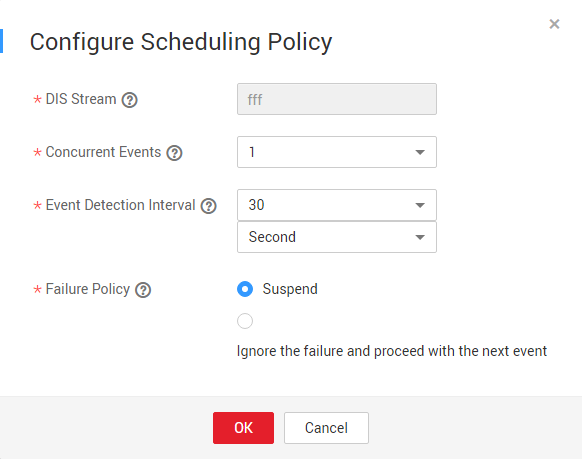
    Table 1 Policy parameters

    Parameter

    Description

    DIS Stream

    Name of the DIS stream. When a new message is sent to the specified DIS stream, Data Development transfers the new message to the job to trigger the job running.

    Concurrent Events

    Number of jobs that can be concurrently processed. The maximum number of concurrent events is 10.

    Event Detection Interval

    Interval at which the system detects the DIS stream or OBS path for new messages. The unit of the interval can be set to second or minute.

    Failure Policy

    Select a policy to be performed after scheduling fails.

    • Stop scheduling
    • Ignore failure and proceed

Rerunning a Job After the Job Is Paused

If event-based scheduling is configured for a node in a real-time job, you can disable the node and then restore it. When the node is restored, you can select where you can resume running.

  1. Log in to the DLF console.
  2. In the navigation tree of the DLF console, choose Monitoring > Monitor Job.
  3. On the Real-Time Job Monitoring tab page, click a job name.
  4. On the job monitoring page, right-click a node with event-driven scheduling configured and choose Disable from the shortcut menu.
  5. Right-click the node and choose Resume from the shortcut menu. The Resume Node Running dialog box is displayed, as shown in Table 2.

    Figure 4 Resuming node running
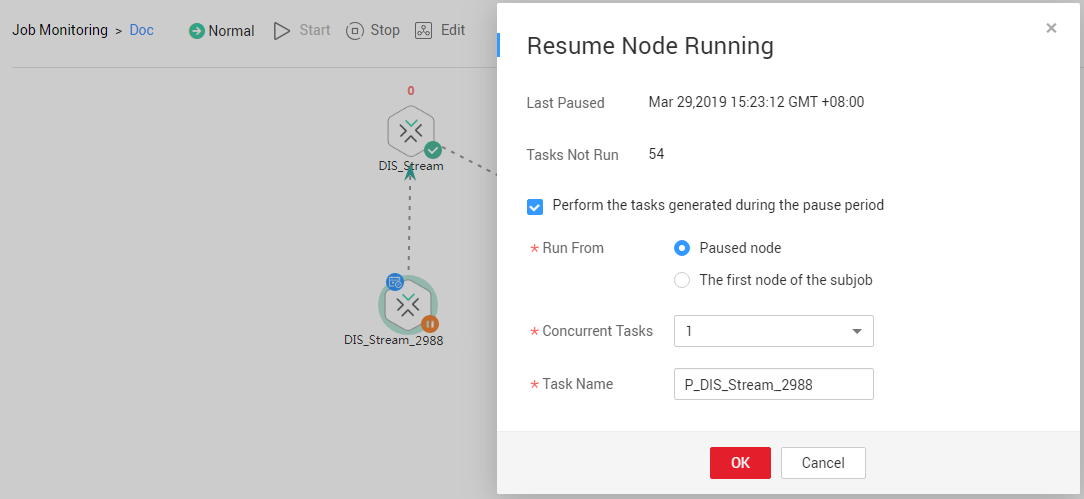
    Table 2 Resumption parameters

    Parameter

    Description

    Last Paused

    Start time when a node is suspended.

    Tasks Not Run

    Number of tasks that are not running during node suspension.

    Parameters for performing the tasks generated during the pause period

    Run From

    Position from which running restarts.

    • Paused node
    • The first node of the subjob

    Concurrent Tasks

    Number of tasks to be processed.

    Task Name

    Task to be resumed.

Utilizamos cookies para mejorar nuestro sitio y tu experiencia. Al continuar navegando en nuestro sitio, tú aceptas nuestra política de cookies. Descubre más

Feedback

Feedback

Feedback

0/500

Selected Content

Submit selected content with the feedback