Pod Monitoring
To view the resource usages of pods, go to the Pods tab, where you can view information about all pods in a cluster and monitoring data of each pod, such as the CPU usage, memory usage, inbound rate, and outbound rate.
Navigation Path
- Log in to the CCE console and click the cluster name to access the cluster console.
- In the navigation pane on the left, choose Monitoring Center. Then click Pods.
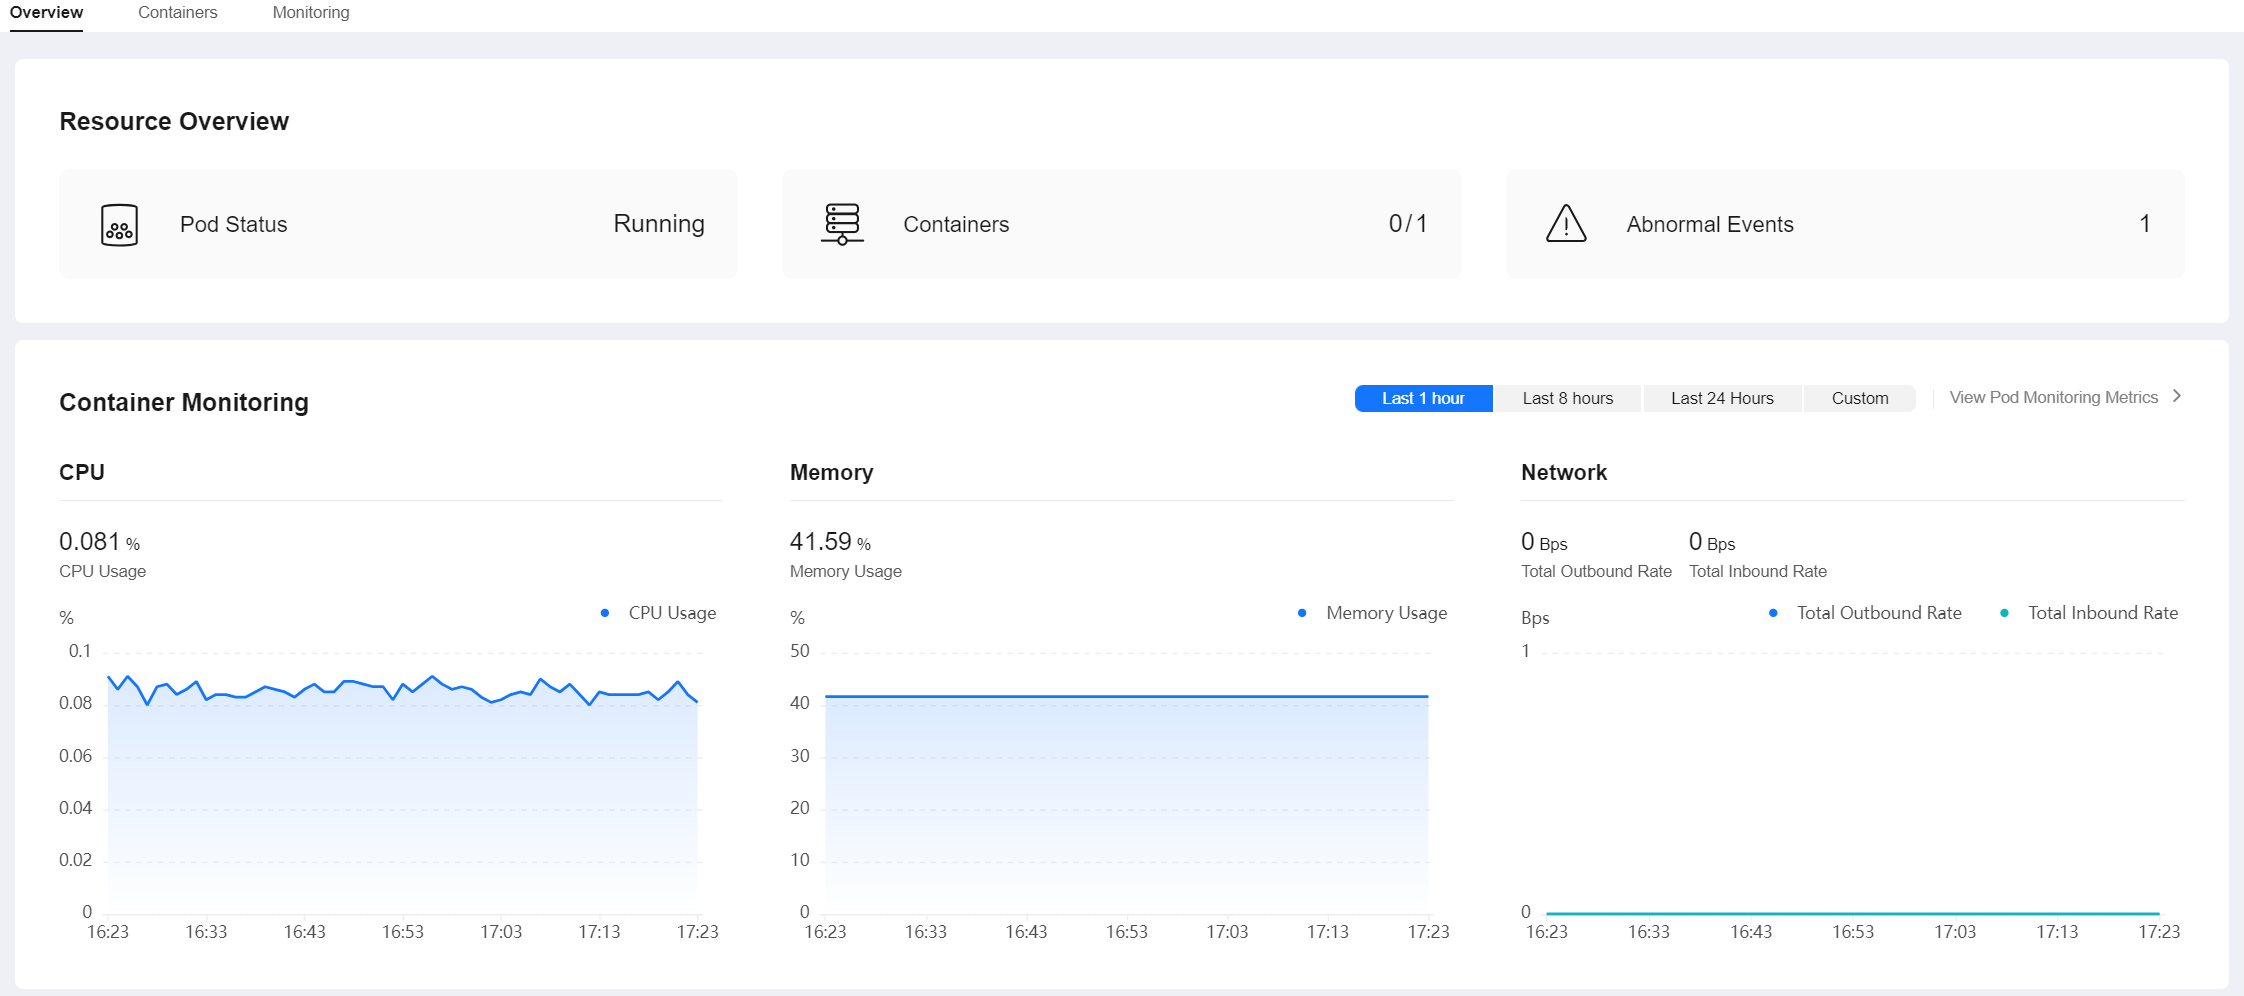
Information about all pods is displayed. To view the monitoring data of a pod, click the pod name to go to the Overview tab. You can also click the Containers or Monitoring tab to view the corresponding information.
Pods
You can view the name, status, namespace, IP address, node, number of restarts, CPU request, CPU limit, memory request, memory limit, used CPUs, used memory, CPU usage, and memory usage of each pod.

You can select a namespace in the upper right corner, or select Pod, Status, Namespace, Pod IP, and Node above the list to quickly locate the required pod.
You can click Export in the upper right corner of the list to export details of all pods or the selected pods. The exported file is in .xlsx format, and the file name contains the timestamp.
Overview
You can click the pod name to view the resource overview, including the pod status, number of containers (abnormal/total), and abnormal events. You can also view the monitoring overview of the pod in the last hour, including the CPU usage, memory usage, and network inbound/outbound rate.

The Overview tab also shows the container usage trend. You can switch the metrics in the upper right corner of the chart to view the CPU usage, used CPUs, memory usage, and used memory of each container in the pod. You can also click Top 5 (Descending) or Top 5 (Ascending) in the upper left corner to view the top 5 data in descending or ascending order.
For more metrics, go to the Monitoring tab.
Containers
This tab contains details such as the name, status, namespace, number of restarts, and image of each container.

You can find the desired container by name, status, or namespace. You can click Export in the upper right corner of the list to export details of all containers or the selected containers. The exported file is in .xlsx format, and the file name contains the timestamp.
Monitoring
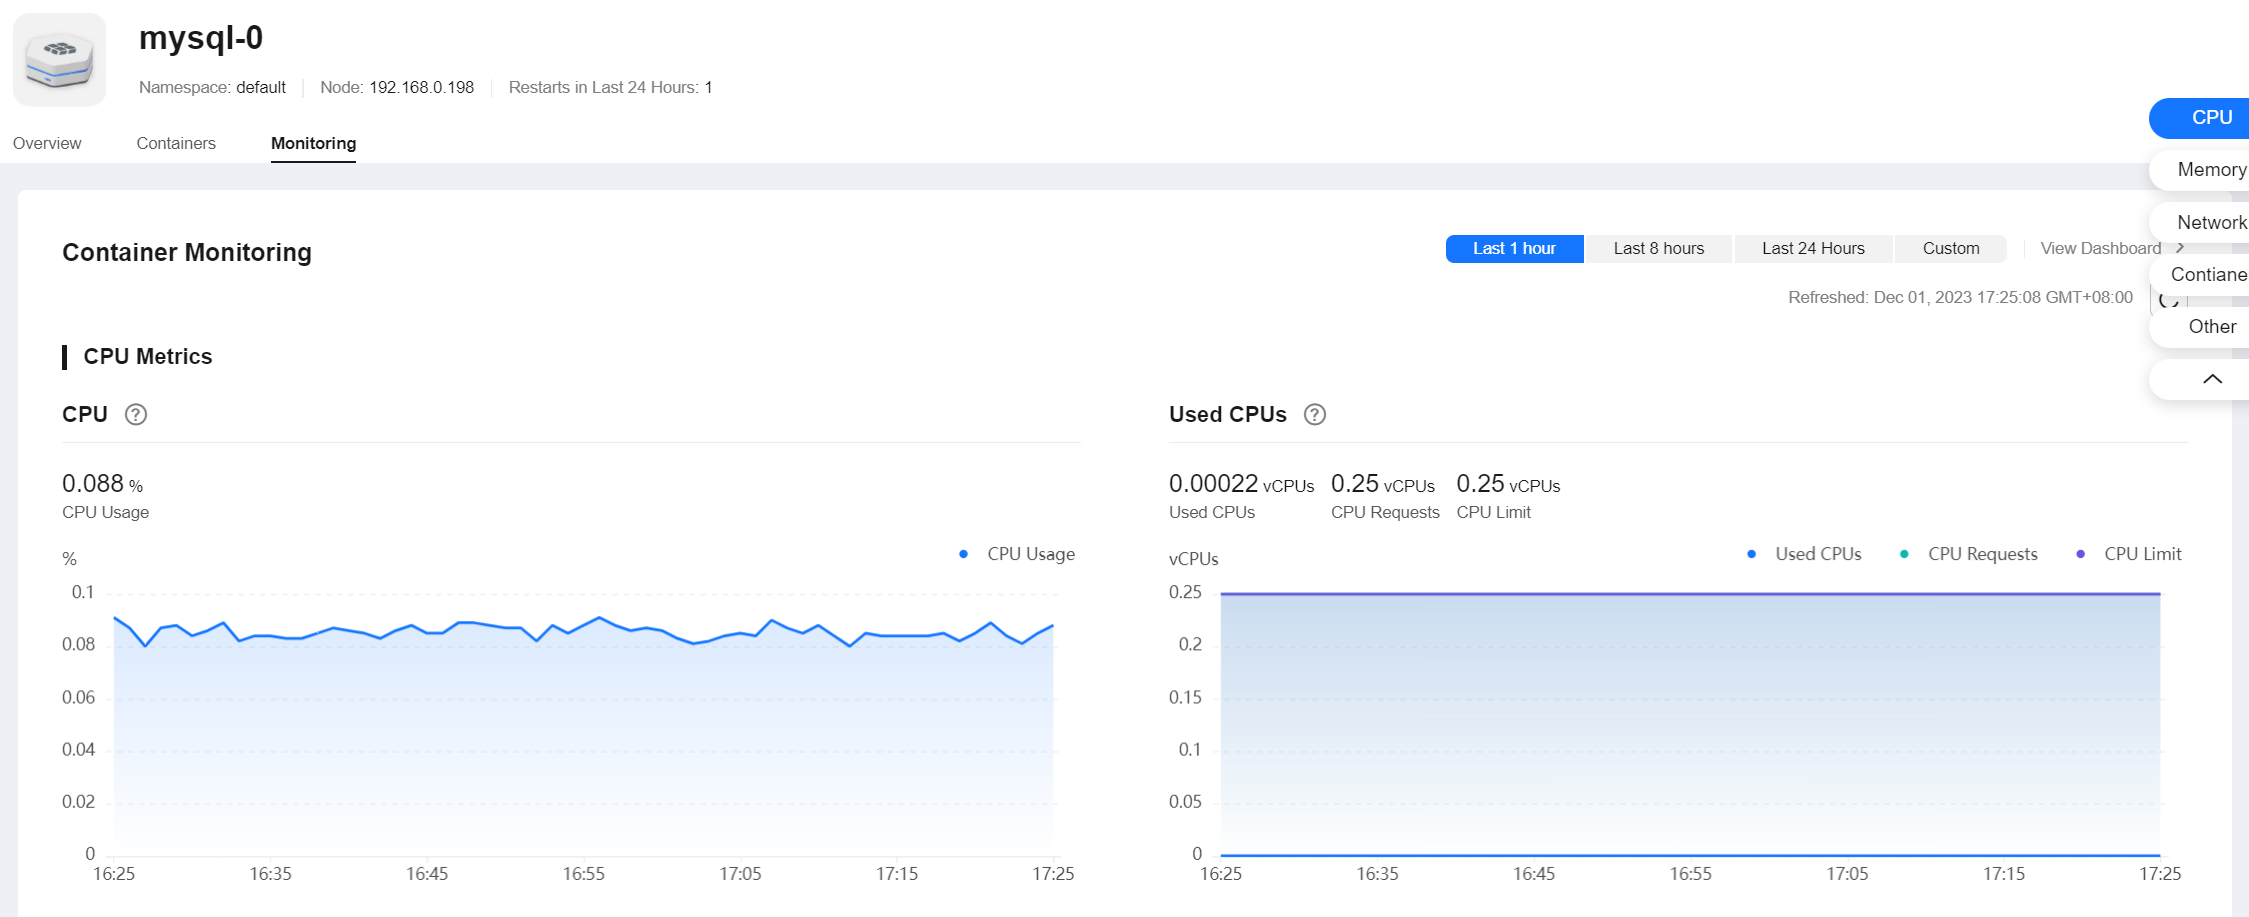
This tab shows the resource usage of the pod in each dimension in the last 1 hour, last 8 hours, last 24 hours, or a custom period. To view more monitoring data, click View Dashboard to access the Dashboard page. For details, see Using Dashboard.

- CPU Metrics
- CPU usage: the percentage of CPU used by all containers in a pod in different time periods with respect to the total CPU limit for all containers.
- Used CPU: the CPU that the pod is using.
- CPU request: the CPU requested for the pod.
- CPU limit: the CPU limit configured for the pod. When the used CPU is close to this limit, the CPU usage of the containers will be limited, affecting container performance.
- Memory Metrics
- Memory usage: the percentage of memory used by all containers in the pod in different time periods with respect to the total memory limit for all containers.
- Used memory: the memory that the pod is using.
- Memory request: the memory requested for the pod.
- Memory limit: the memory limit configured for the pod. When the used memory is close to this limit, OOM will occur.
- Networking Metrics
- Total outbound rate: the total number of bytes transmitted by all containers in the pod per second.
- Total inbound rate: the total number of bytes received by all containers in the pod per second.
- Container Metrics
- Container CPU usage: the percentage of CPU used by each container in the pod in different time periods with respect to the CPU limit for each container.
- Container memory usage: the percentage of memory used by each container in the pod in different time periods with respect to the memory limit for each container.
- Container CPU throttled: the percentage of time duration each container has been throttled in different time periods.
- Container network packet loss rate: the percentage of packets not received by each container of the pod to packets sent to the container in different time periods.
- Other Metrics
- Historical pod status: the status of the pod in different periods.
- Historical container status: the status of each container in the pod in different time periods.
Feedback
Was this page helpful?
Provide feedbackThank you very much for your feedback. We will continue working to improve the documentation.See the reply and handling status in My Cloud VOC.
For any further questions, feel free to contact us through the chatbot.
Chatbot


