Collecting Logs
Constraints
- A maximum of 50 log collection rules can be configured for each cluster.
- This add-on cannot collect .gz, .tar, and .zip logs or access symbolic links of logs.
- In each cluster, up to 10,000 single-line logs can be collected per second, and up to 2,000 multi-line logs can be collected per second.
- If a volume is attached to the data directory of a service container, this add-on cannot collect data from the parent directory. In this case, you need to configure a complete data directory.
Billing
LTS does not charge you for creating log groups and offers a free quota for log collection every month. You pay only for log volume that exceeds the quota. For details, see Price Calculator.
Log Collection
- Enable log collection.
Enabling log collection during cluster creation
- Log in to the CCE console.
- In the upper right corner, click Buy Cluster.
- On the Select Add-on page, select Cloud Native Logging.
- Click Next: Add-on Configuration in the lower right corner and select the required logs.
- Container logs: A log collection policy named default-stdout will be created, and standard output logs in all namespaces will be reported to LTS.
- Kubernetes events: A log collection policy named default-event will be created, and Kubernetes events in all namespaces will be reported to LTS.
- Click Next: Confirm Configuration. On the displayed page, click Submit.
Enabling log collection for an existing cluster
- Log in to the CCE console and click the cluster name to access the cluster console. In the navigation pane on the left, choose Logging.
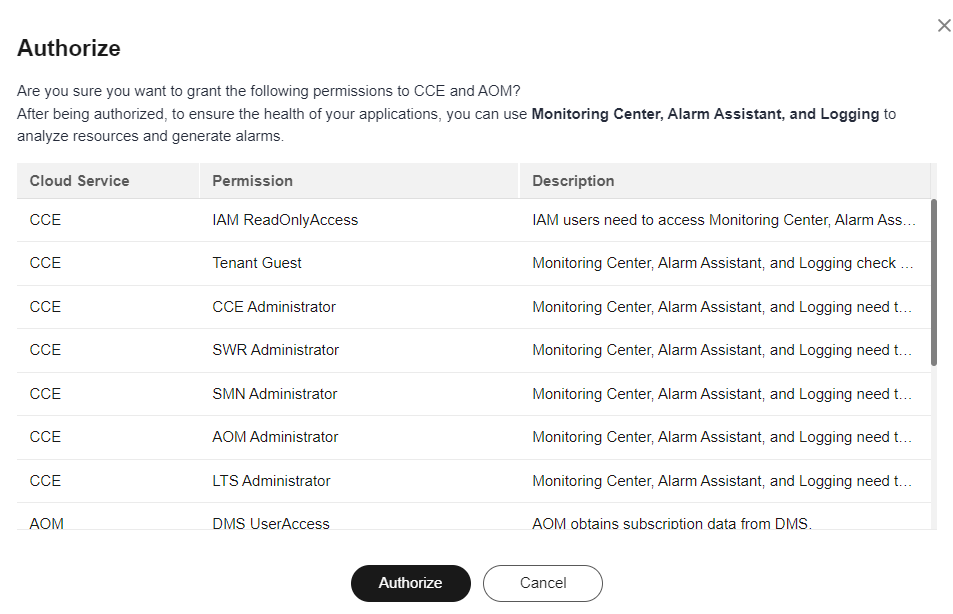
- (Optional) If you are not authorized, obtain required permissions first.
In the displayed dialog box, click Authorize.
- Click Enable and wait for about 30 seconds until the log page is automatically displayed.
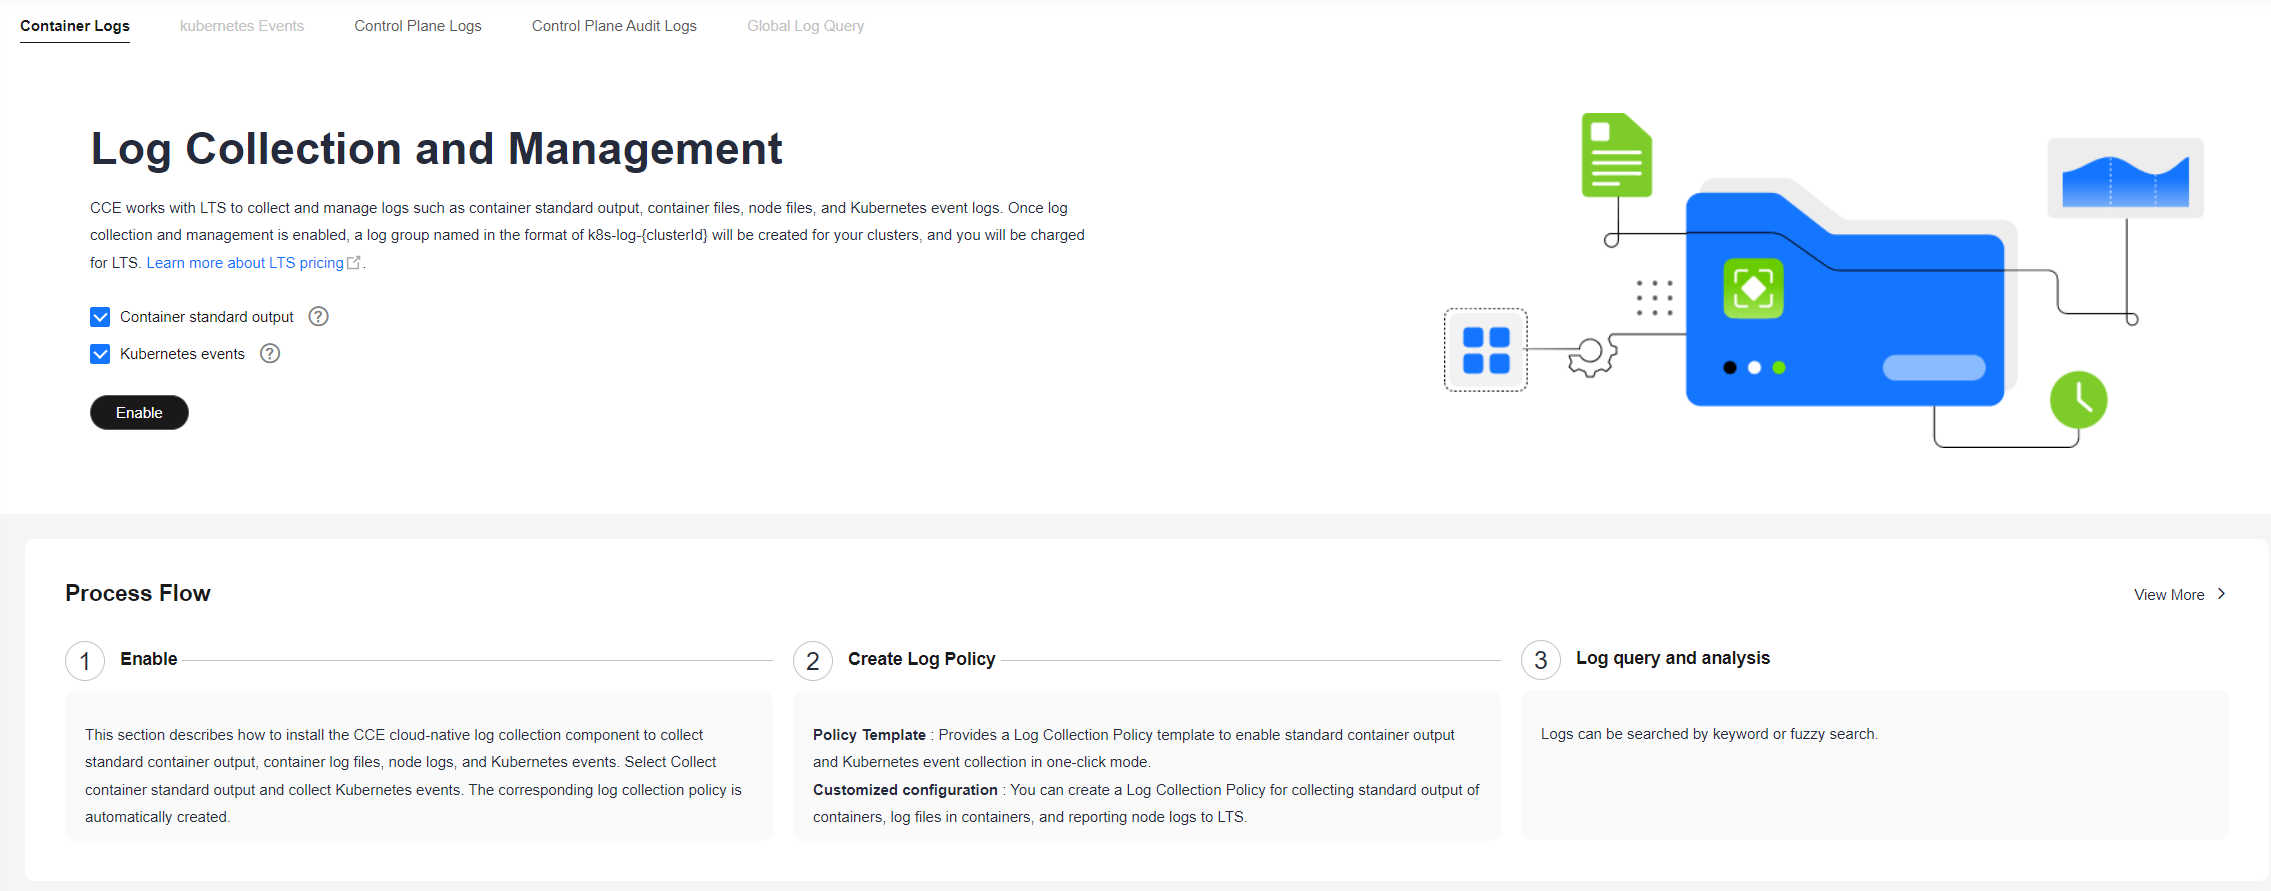
Standard output logs: A log collection policy named default-stdout will be created, and standard output logs in all namespaces will be reported to LTS.
Kubernetes events: A log collection policy named default-event will be created, and Kubernetes events in all namespaces will be reported to LTS.
- View and configure log collection policies.
- On the CCE console, click the cluster name to access the cluster console. In the navigation pane on the left, choose Logging.
Click View Log Collection Policies in the upper right corner.
All log collection policies reported to LTS are displayed.
Figure 1 Viewing log collection policies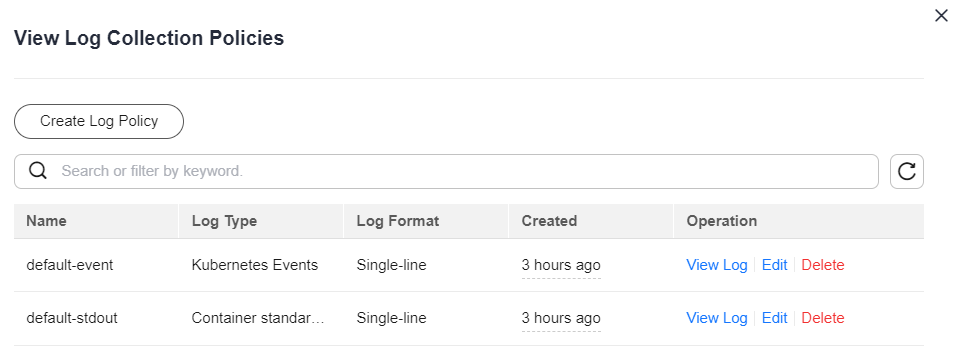
If Container standard output and Kubernetes events are selected during add-on installation, two log collection policies will be created, and the collected logs will be reported to the default log group and log streams.
- Click Create Log Policy and configure parameters as required.
Policy Template: If Container standard output and Kubernetes events are not selected during add-on installation or their log collection policies are deleted, you can use this option to create default log collection policies.
Figure 2 Policy template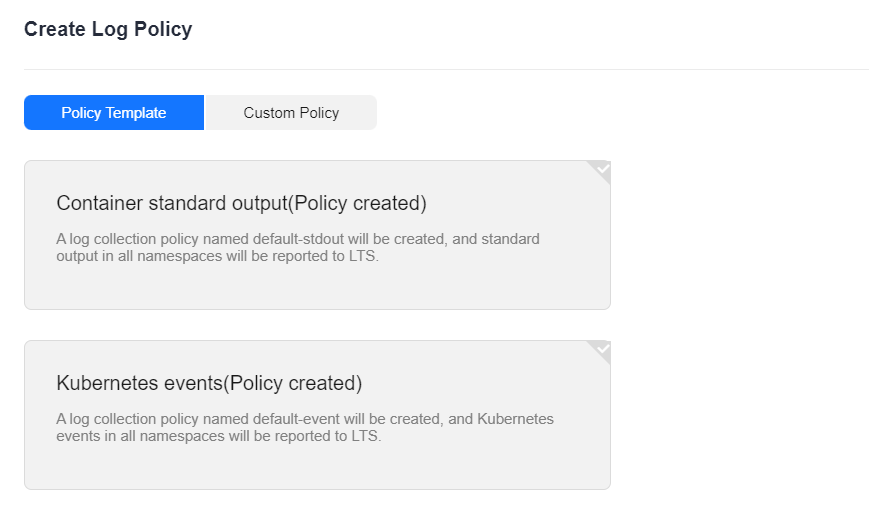
Custom Policy: You can use this option to create custom log collection policies.
Figure 3 Custom policy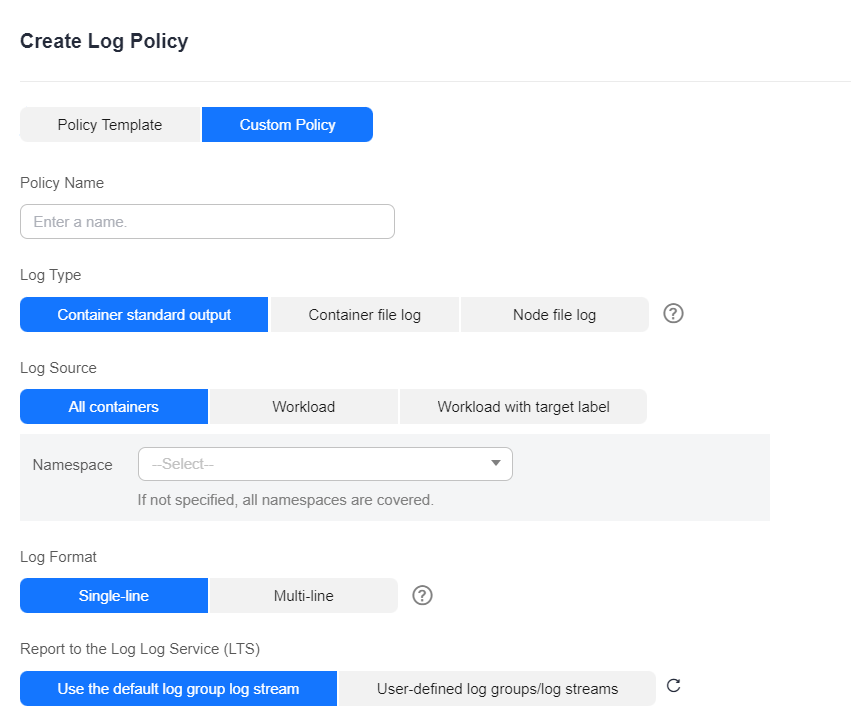
- Click Edit to modify an existing log collection policy.
- Click Delete to delete an existing log collection policy.
- View the logs.
- On the CCE console, click the cluster name to access the cluster console. In the navigation pane on the left, choose Logging.
- View different types of logs:
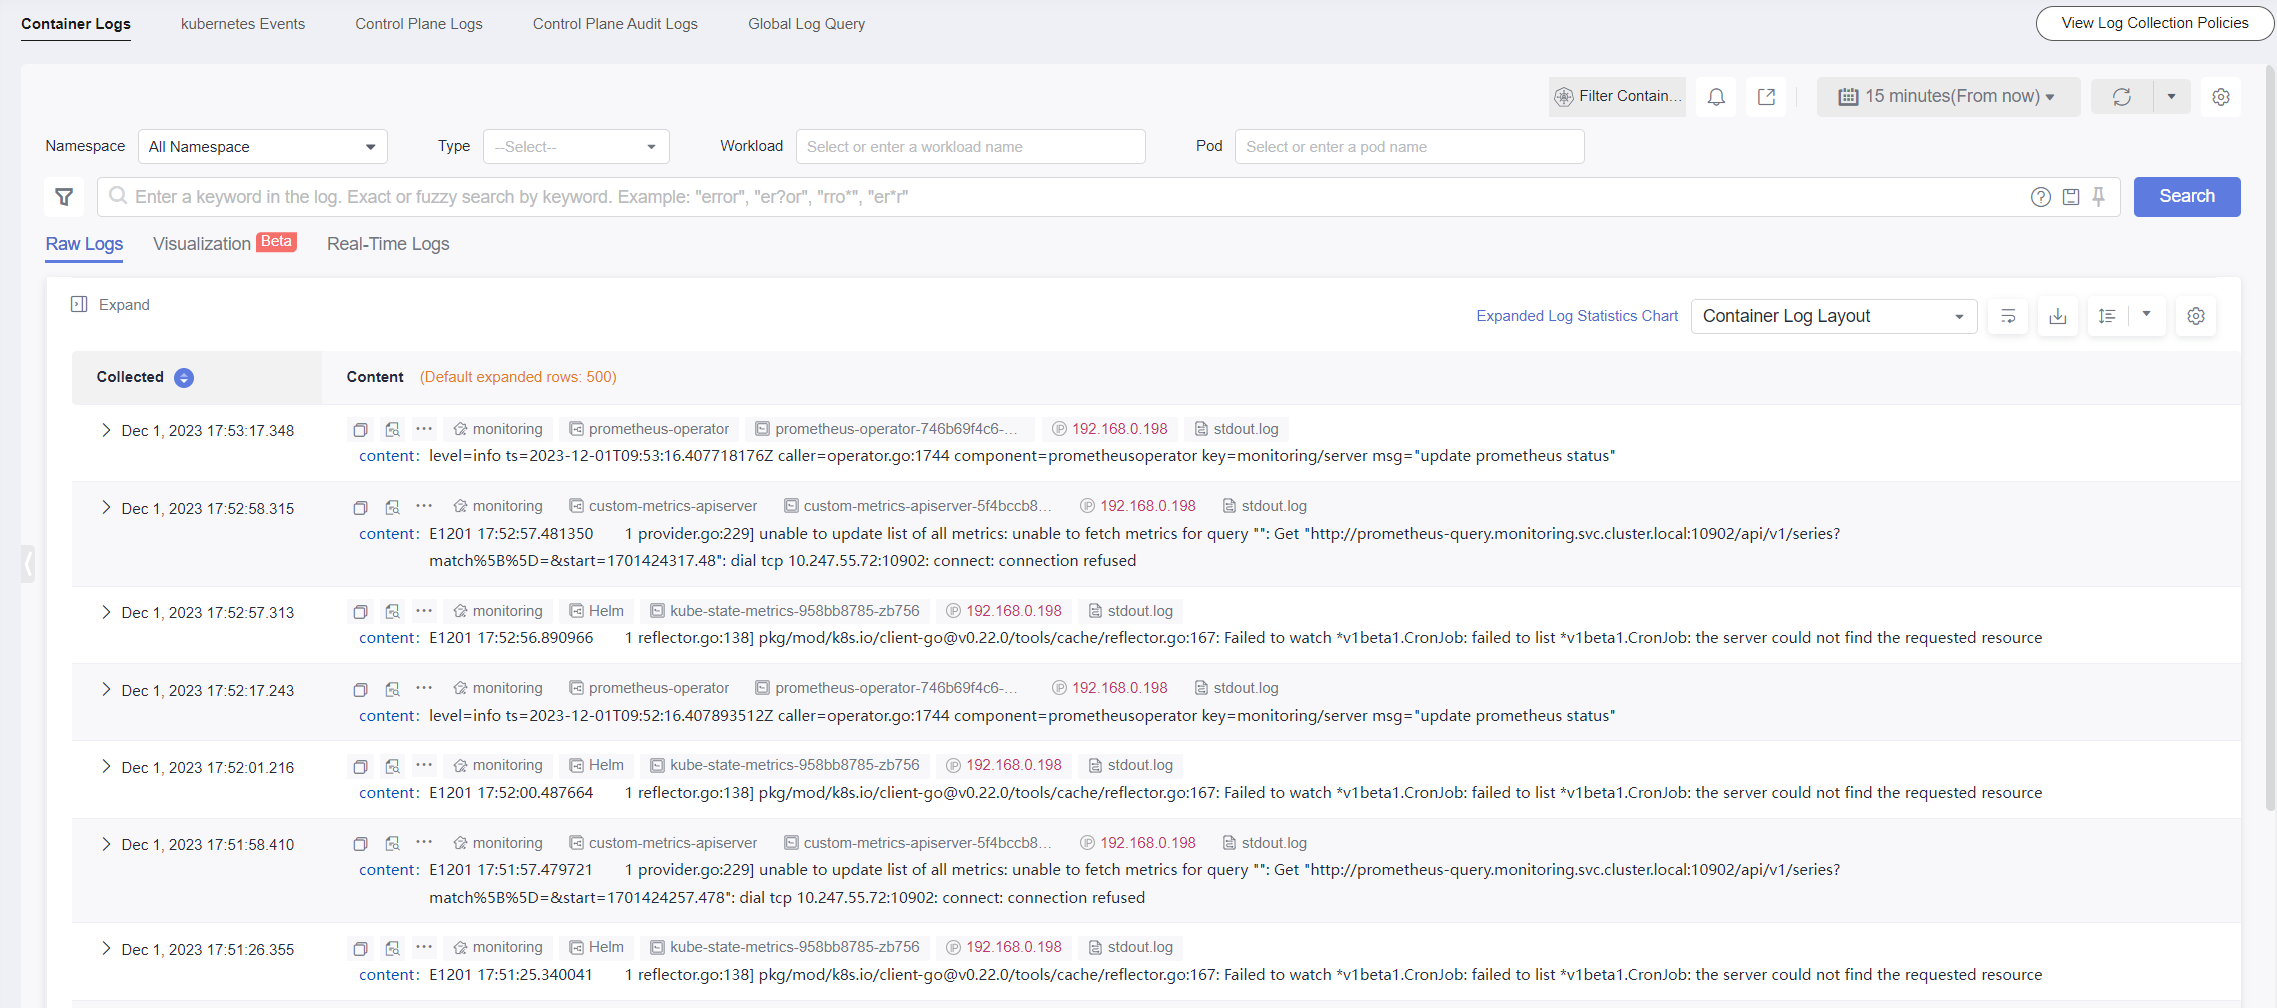
- Container Logs: displays all logs in the default log stream stdout-{Cluster ID} of the default log group k8s-log-{Cluster ID}. You can search for logs by workload.
Figure 4 Querying container logs
- Kubernetes Events: displays all Kubernetes events in the default log stream event-{Cluster ID} of the default log group k8s-log-{Cluster ID}.
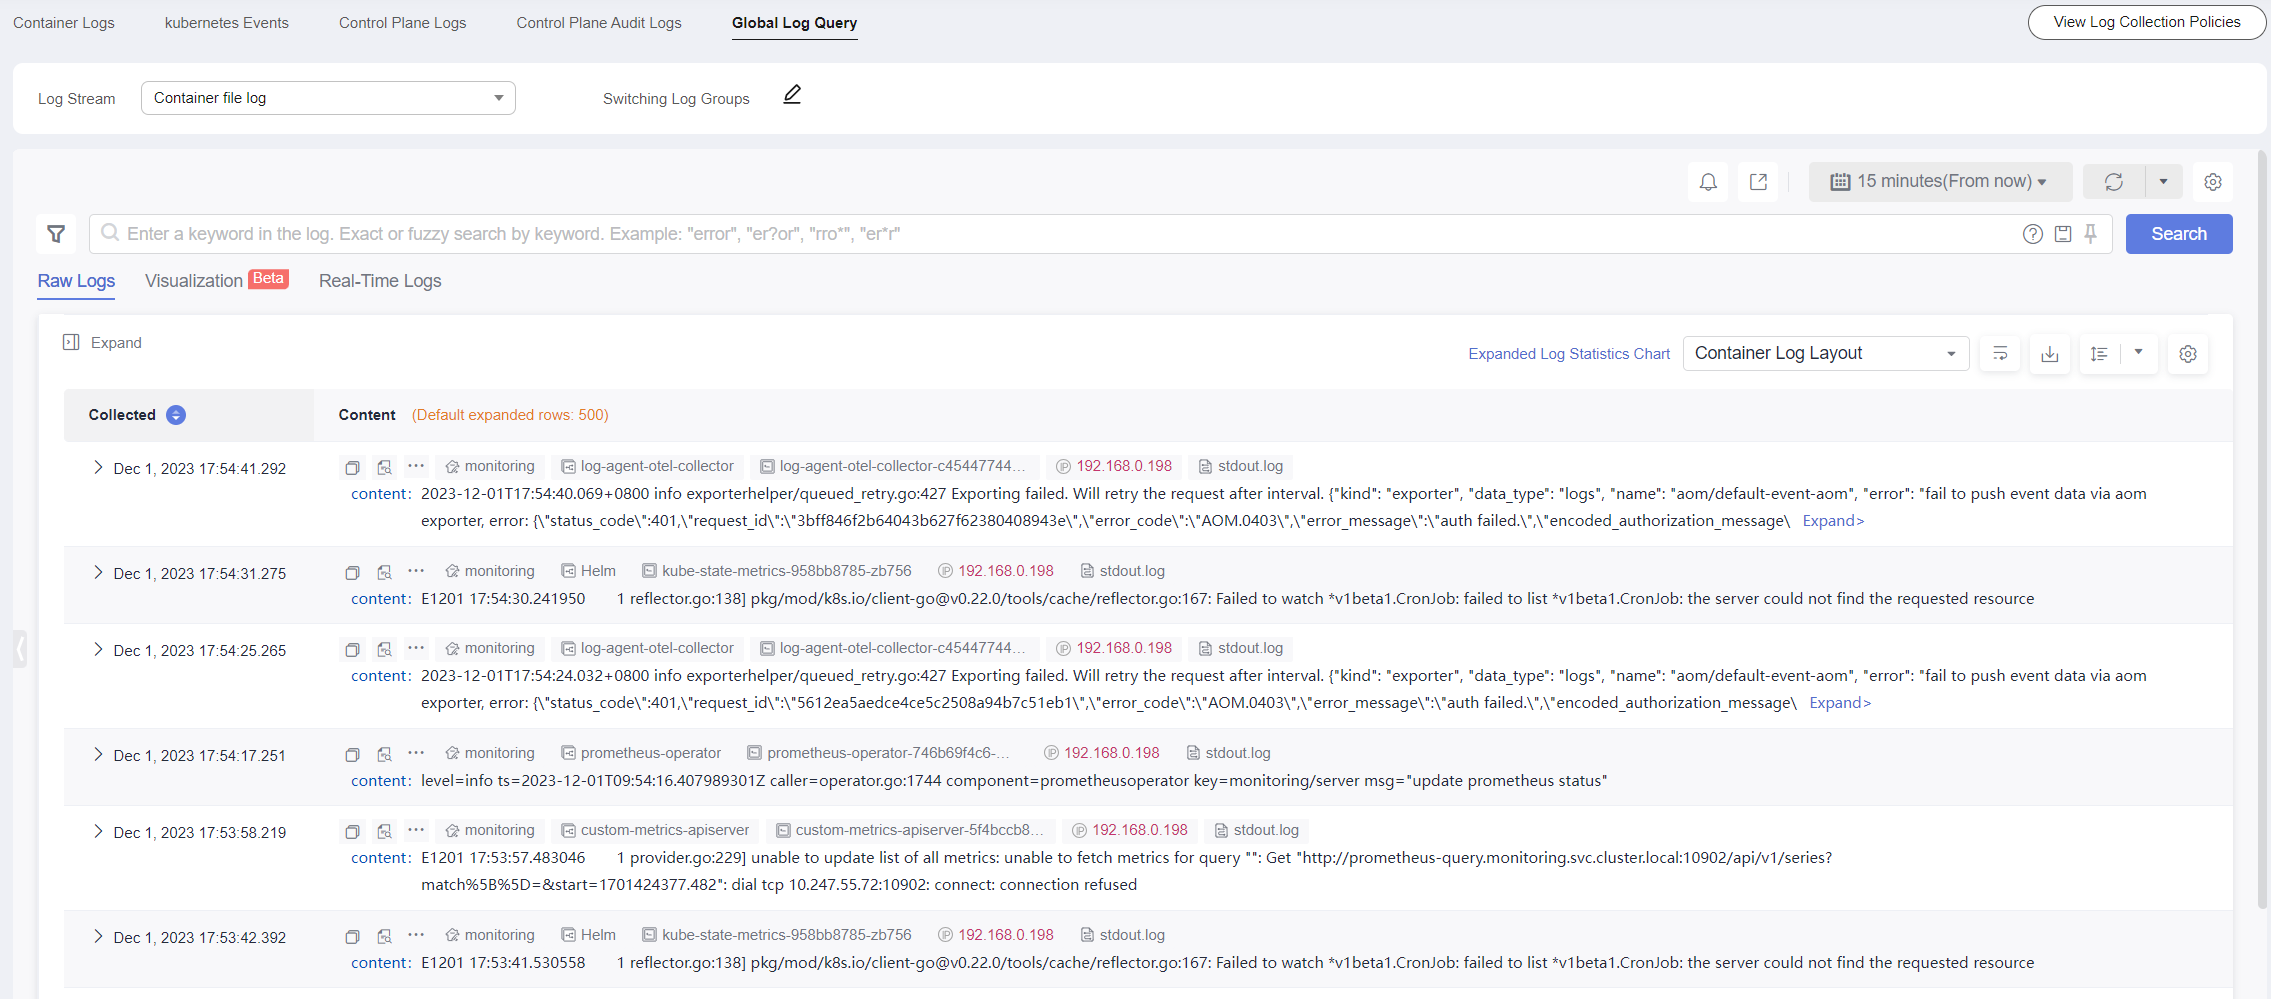
- Global Log Query: You can view logs in the log streams of all log groups. You can specify a log stream to view the logs. By default, the default log group k8s-log-{Cluster ID} is selected. You can click the edit icon on the right of Switching Log Groups to switch to another log group.
Figure 5 Global log query
- Container Logs: displays all logs in the default log stream stdout-{Cluster ID} of the default log group k8s-log-{Cluster ID}. You can search for logs by workload.
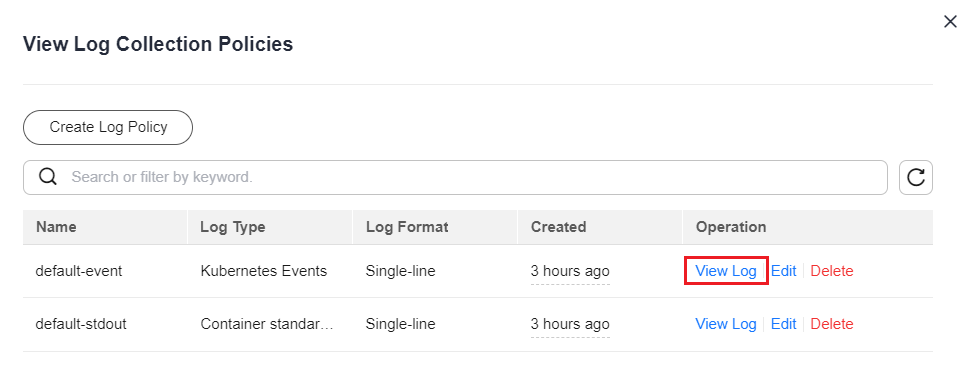
- Click View Log Collection Policies in the upper right corner. Locate the log collection policy and click View Log to go to the log list.
Figure 6 Viewing logs
Troubleshooting
- All components except log-operator are not ready, and the volume failed to be attached to the node.
Solution: Check the logs of log-operator. During add-on installation, the configuration files required by other components are generated by log-operator. If the configuration files are invalid, all components cannot be started.
The log information is as follows:
MountVolume.SetUp failed for volume "otel-collector-config-vol":configmap "log-agent-otel-collector-config" not found
- "Failed to create log group, the number of log groups exceeds the quota" is reported in the standard output log of log-operator.
Example:
2023/05/05 12:17:20.799 [E] call 3 times failed, resion: create group failed, projectID: xxx, groupName: k8s-log-xxx, err: create groups status code: 400, response: {"error_code":"LTS.0104","error_msg":"Failed to create log group, the number of log groups exceeds the quota"}, url: https://lts.cn-north-4.myhuaweicloud.com/v2/xxx/groups, process will retry after 45sSolution: On the LTS console, delete unnecessary log groups. For details about the log group quota, see Log Groups.
- Logs cannot be reported, and "log's quota has full" is reported in the standard output log of the OTel component.
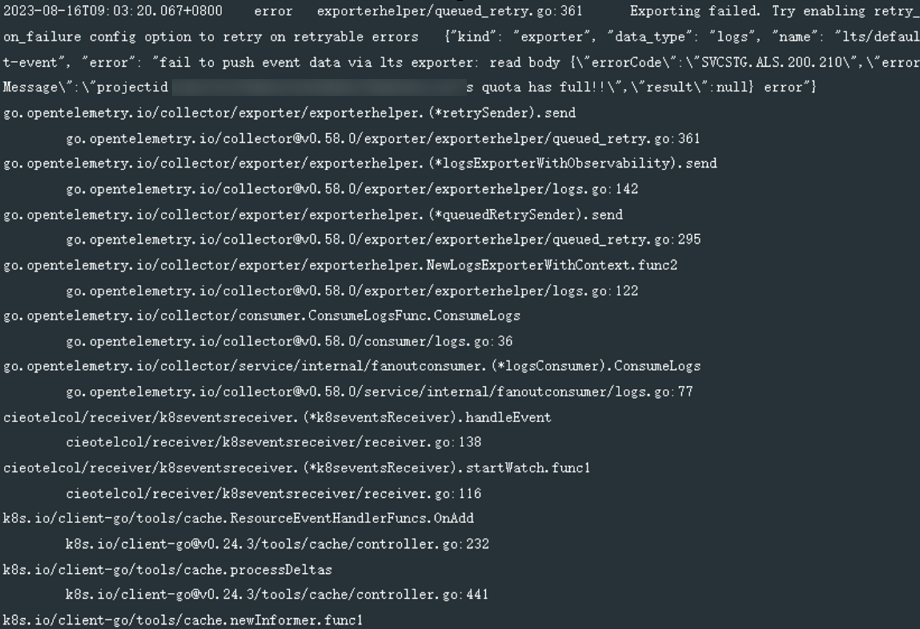
Solution:
LTS provides a free log quota. If the quota is used up, you will be charged for the excess log usage. If an error message is displayed, the free quota has been used up. To continue collecting logs, log in to the LTS console, choose Configuration Center in the navigation pane on the left, and enable Continue to Collect Logs When the Free Quota Is Exceeded.
Figure 7 Quota configuration
- Text logs cannot be collected because wildcards are configured for the collection directory.
Troubleshooting: Check the volume mounting status in the workload configuration. If a volume is attached to the data directory of a service container, this add-on cannot collect data from the parent directory. In this case, you need to set the collection directory to a complete data directory. For example, if the data volume is attached to the /var/log/service directory, logs cannot be collected from the /var/log or /var/log/* directory. In this case, you need to set the collection directory to /var/log/service.
Solution: If the log generation directory is /application/logs/{Application name}/*.log, attach the data volume to the /application/logs directory and set the collection directory in the log collection policy to /application/logs/*/*.log.
Feedback
Was this page helpful?
Provide feedbackThank you very much for your feedback. We will continue working to improve the documentation.See the reply and handling status in My Cloud VOC.
For any further questions, feel free to contact us through the chatbot.
Chatbot


