Configuraciones de alarma
CCE interactúa con Application Operations Management (AOM) para informar de alarmas y eventos. Al establecer reglas de alarma en AOM, puede comprobar si los recursos de los clústeres son normales de manera oportuna.
Proceso
- Creación de un tema en SMN
- Creación de una política de acción
- Adición de una regla de alarma
- Alarmas de eventos: Genere alarmas basadas en los eventos reportados por clústeres a AOM. Para obtener más información acerca de los eventos y las configuraciones, consulte Adición de alarmas de eventos.
- Alarmas umbral: Genere alarmas basadas en los umbrales de las métricas de monitoreo, como la utilización de recursos de servidores y componentes. Para obtener más información sobre los umbrales y las configuraciones de métricas, consulte Adición de alarmas de umbral.
Creación de un tema en SMN
Simple Message Notification (SMN) envía mensajes a los suscriptores con correos electrónicos, mensajes SMS y solicitudes HTTP/HTTPS.
Un tema se utiliza para publicar mensajes y suscribirse a notificaciones. Sirve como un canal de transmisión de mensajes entre editores y suscriptores.
Necesita crear un tema y suscribirse a él. Para obtener más información, consulte Crear un tema y Suscribirse a un tema.

Después de suscribirse a un tema, confirme la suscripción en el correo electrónico o mensaje SMS para que la notificación surta efecto.
Creación de una política de acción
AOM le permite personalizar las políticas de acción de alarma. Puede crear una política de acción de alarma para asociar un tema de SMN y una plantilla de mensaje. También puede personalizar el contenido de las notificaciones mediante una plantilla de mensaje.
Para obtener más información, consulte Creación de políticas de acción de alarma. Cuando cree una política de acción, seleccione el tema al que se ha creado y al que está suscrito en Creación de un tema en SMN.
Adición de alarmas de eventos
A continuación se utiliza la alarma NodeNotReady como ejemplo para describir cómo agregar una alarma de evento.
Esta función es proporcionada por AOM. Para obtener más información sobre los parámetros, consulte Creación de reglas de alarma de eventos.
| Nombre del evento | Origen | Descripción | Solución |
|---|---|---|---|
| NodeNotReady | CCE | Una alarma se activa inmediatamente cuando un nodo es anormal. | Inicie sesión en el clúster y compruebe el estado del nodo para el que se genera la alarma. Establezca el nodo como no programado y programe los pods de servicio a otro nodo. |
| Rebooted | CCE | Una alarma se activa inmediatamente cuando se reinicia un nodo. | Inicie sesión en el clúster para comprobar el estado del nodo para el que se genera la alarma, compruebe si el nodo se puede iniciar correctamente y busque la causa del reinicio. |
| KUBELETIsDown | CCE | Una alarma se activa inmediatamente cuando un nodo es anormal. | Inicie sesión en el clúster y compruebe el estado del nodo para el que se genera la alarma. Establezca el nodo como no programado y programe los pods de servicio a otro nodo. Luego, reinicie kubelet. |
| DOCKERIsDown | CCE | Una alarma se activa inmediatamente cuando un nodo es anormal. | Inicie sesión en el clúster y compruebe el estado del nodo para el que se genera la alarma. Establezca el nodo como no programado y programe los pods de servicio a otro nodo. A continuación, reinicie Docker. |
| KUBEPROXYIsDown | CCE | Una alarma se activa inmediatamente cuando un nodo es anormal. | Inicie sesión en el clúster y compruebe el estado del nodo para el que se genera la alarma. Establezca el nodo como no programado y programe los pods de servicio a otro nodo. |
| KernelOops | CCE | Una alarma se activa inmediatamente cuando un nodo es anormal. | Inicie sesión en el clúster y compruebe el estado del nodo para el que se genera la alarma. Establezca el nodo como no programado y programe los pods de servicio a otro nodo. |
| ConntrackFull | CCE | Una alarma se activa inmediatamente cuando un nodo es anormal. | Inicie sesión en el clúster y compruebe el estado del nodo para el que se genera la alarma. Establezca el nodo como no programado y programe los pods de servicio a otro nodo. |
| NodePoolSoldOut | CCE | Una alarma se activa inmediatamente cuando los recursos del grupo de nodos están agotados. | Establezca la conmutación automática del grupo de nodos o cambie las especificaciones del grupo de nodos. |
| NodeCreateFailed | CCE | Una alarma se activa inmediatamente después de un fallo de creación de nodo. | Rectifique el error y cree el nodo de nuevo. |
| ScaleUpTimedOut | CCE | Una alarma se activa inmediatamente después del tiempo de espera de la expansión del nodo. | Rectifique el error e intente expansión de nuevo. |
| ScaleDownFailed | CCE | Una alarma se activa inmediatamente después del tiempo de espera de la reducción del nodo. | Rectifique el error e intente la reducción de nuevo. |
| BackOffPullImage | CCE | Error en el reintento de extracción de imagen. | Inicie sesión en el clúster, localice la causa del error y vuelva a desplegar la carga de trabajo del servicio. |
- Inicie sesión en la consola de AOM.
- En el panel de navegación, elija Alarm Center > Alarm Rules y haga clic en Add Alarm.
- Establezca una regla de alarma.
- Rule Type: Seleccione Event alarm.
- Alarm Source: Seleccione CCE.
- Select Object: Seleccione Event Name y, a continuación, haga clic en NodeNotReady. Puede filtrar objetos activados por tipo de notificación, nombre de evento, gravedad de alarma, atributo personalizado, espacio de nombres y nombre de clúster.
- Triggering Policy: Seleccione Immediate Triggering.
- Alarm Mode: Seleccione Direct Alarm Reporting.
- Action Policy: seleccione la política de acción creada en Creación de una política de acción.
Esta regla de alarma funciona de la siguiente manera:
Si un nodo en el clúster se vuelve anormal, CCE informa del evento NodeNotReady a AOM. AOM le notifica inmediatamente con SMN según la política de acción.
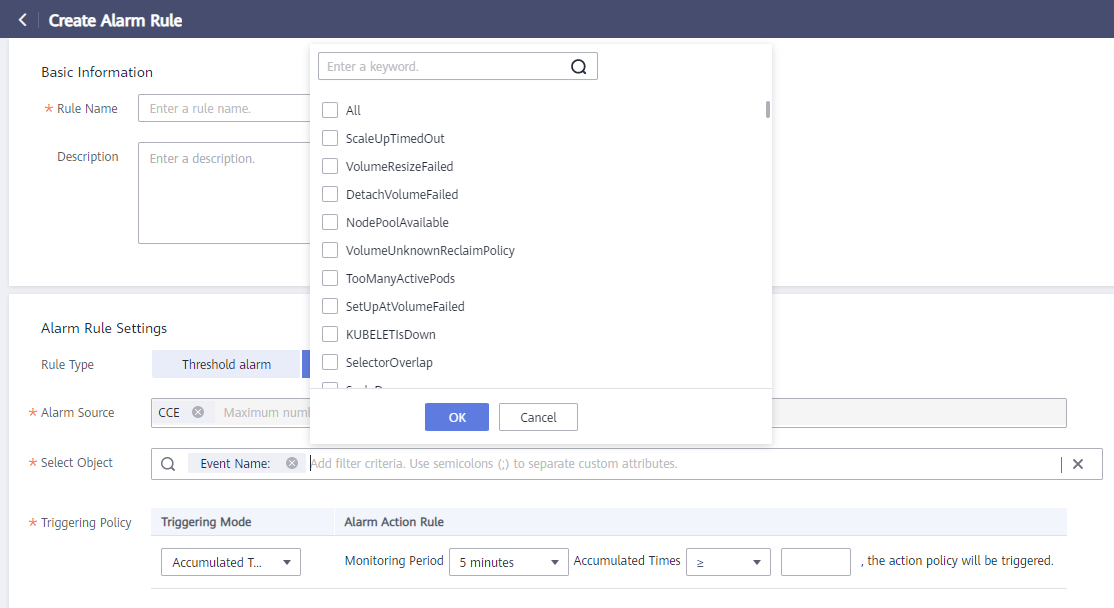
Figura 1 Creación de una alarma de evento
- Haga clic en Create Now.
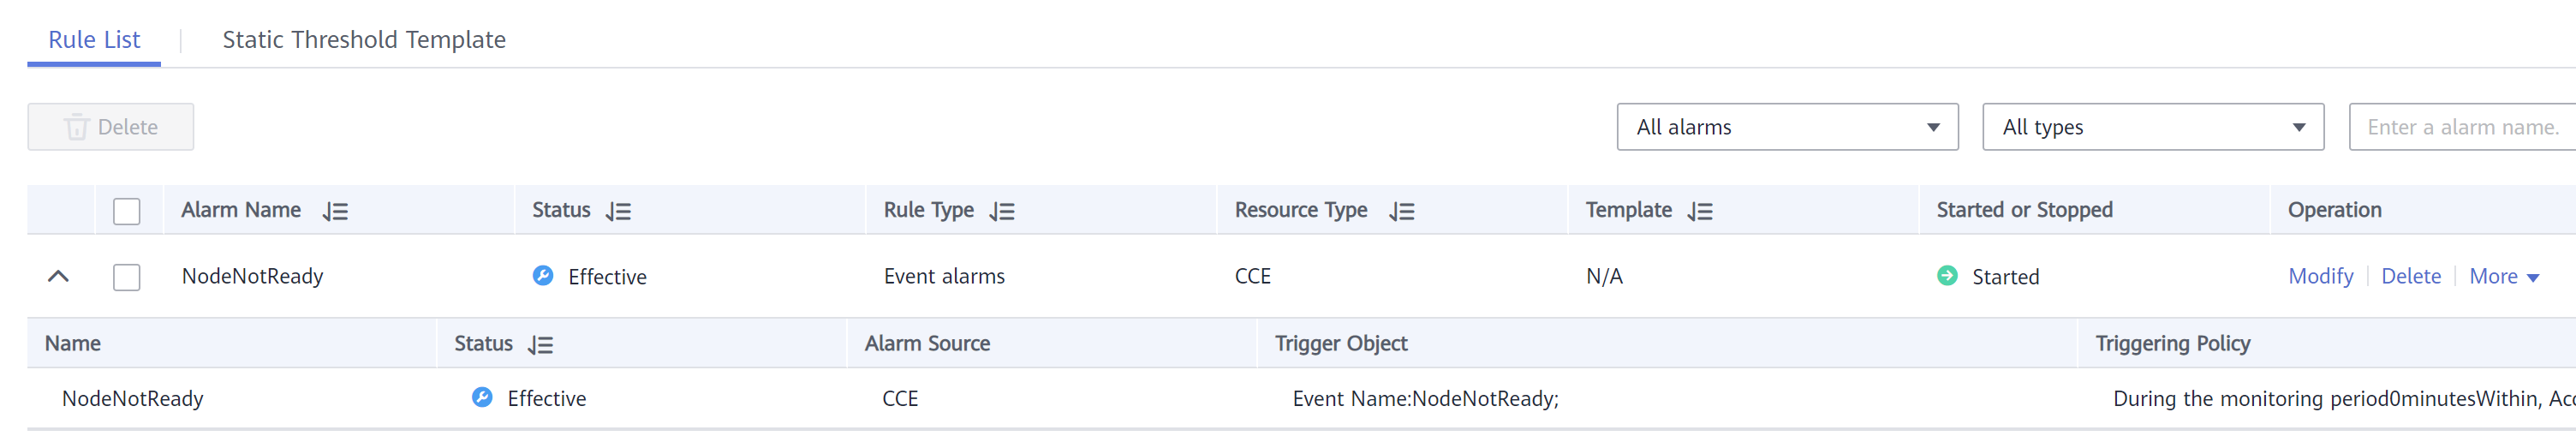
Si se muestra la siguiente información en la lista de reglas, la regla se crea correctamente.
Eventos de CCE
Las alarmas de eventos se generan basándose en los eventos notificados por CCE a AOM. CCE informa de una serie de eventos a AOM. Puede ver eventos específicos en las áreas Alarm Rule Settings y agregar alarmas de eventos según sea necesario.
CCE admite los siguientes eventos:
- ScaleUpTimedOut
- VolumeResizeFailed
- DetachVolumeFailed
- NodePoolAvailable
- VolumeUnknownReclaimPolicy
- TooManyActivePods
- SetUpAtVolumeFailed
- KUBELETIsDown
- SelectorOverlap
- ScaleDown
- NodeHasInsufficientMemory
- ClaimLost
- UnregisterNetDevice
- VolumeFailedRecycle
- NotTriggerScaleUp
- DeleteUnregistered
- Unhealthy
- FailedDelete
- NetworkCardNotFound
- TooManySucceededPods
- ScaleDownEmpty
- ErrImageNeverPull
- Rebooted
- KUBEPROXYIsDown
- FailedScaleOut
- NodeOutOfDisk
- TaskHung
- WaitForAttachVolumeFailed
- FailedStart
- FailedPullImage
- DeleteNodeWithNoServer
- ReplicaSetCreateError
- CIDRNotAvailable
- ConntrackFull
- NodeHasDiskPressure
- FailedStandBy
- ScaleDownFailed
- NodeNotSchedulable
- FailedToScaleUpGroup
- FailedReconfig
- ScaledUpGroup
- NodeInstallFailed
- CreatingLoadBalancerFailed
- FailedGet
- VolumeFailedDelete
- KernelOops
- ScaleUpFailed
- MountDeviceFailed
- DeletingLoadBalancerFailed
- FixNodeGroupSizeDone
- TearDownAtVolumeFailed
- FailedActive
- OOMKilling
- UnmountDeviceFailed
- DOCKERIsDown
- FailedRollback
- CIDRAssignmentFailed
- DockerHung
- SelectingAll
- NodeNotReady
- ProvisioningFailed
- ProvisioningCleanupFailed
- NodeGroupInBackOff
- BackOffStart
- DeploymentRollbackRevisionNotFound
- FailedScheduling
- FixNodeGroupSizeError
- FilesystemIsReadOnly
- FailedUpdate
- NTPIsDown
- NodeCreateFailed
- BackOffPullImage
- NodeUninstallFailed
- ClaimMisbound
- FailedList
- NodePoolSoldOut
- AUFSUmountHung
- FailedCreate
- UpdateLoadBalancerFailed
- UnexpectedJob
- FailedScaleIn
- TriggeredScaleUp
- AttachVolumeFailed
- FailedRestart
- CNIIsDown
- StartScaledUpGroup
- StartScaleDownEmpty
- DeleteUnregisteredFailed
- Internal error
- External dependency error
- Error al inicializar el subproceso de proceso
- Error al actualizar la base de datos
- Error al crear nodo por grupo de nodos
- Error al eliminar nodo por grupo de nodos
- Error al crear un nodo de suscripción anual/mensual
- Error al cancelar la autorización de acceso a la imagen del principal
- Error al crear la IP virtual para el principal
- Error al eliminar la VM del nodo
- Error al eliminar el grupo de seguridad del nodo
- Error al eliminar el grupo de seguridad del principal
- Error al eliminar el grupo de seguridad del puerto
- Error al eliminar el grupo de seguridad de eni o subeni
- Error al desconectar el puerto del principal
- Error al eliminar el puerto del principal
- Error al eliminar la máquina virtual principal
- Error al eliminar el par de claves del principal
- Error al eliminar la subred del principal
- Error al eliminar la VPC del principal
- Error al eliminar el certificado del clúster
- Error al eliminar el grupo de servidores del principal
- Error al eliminar la IP virtual del principal
- Error al obtener la dirección IP flotante del principal
- Error al obtener la variante de clúster
- Error al obtener el punto del clúster de conexión
- Error al obtener la conexión de Kubernetes
- Error al actualizar el secreto
- Fin del tiempo de espera para la operación
- Se ha agotado el tiempo de espera de la conexión al clúster de Kubernetes
- Error al comprobar el estado del componente o los componentes son anormales
- El nodo no se encuentra en el clúster kubernetes
- El estado del nodo no está listo en el clúster kubernetes
- No se puede encontrar el vm correspondiente de este nodo en ECS
- Error al actualizar el principal
- Error al actualizar el nodo
- Error al cambiar la variante del principal
- Cambiar la variante del tiempo de espera del principal
- Error al pasar la verificación al crear un nodo de suscripción anual/mensual
- Error al instalar el nodo
- Error al limpiar las rutas de la red contenedor del clúster en la VPC
- El estado del clúster es No disponible
- El estado del clúster es un error
- El estado del clúster no se actualiza durante mucho tiempo
- Error al actualizar el estado del principal después de actualizar el tiempo de espera del clúster
- Error al actualizar trabajos en ejecución después de actualizar el tiempo de espera del clúster
- Error al actualizar el estado del clúster
- Error al actualizar el estado del nodo
- Error al quitar el nodo estático de la base de datos
- Error al actualizar el estado del nodo a anormal después del tiempo de espera de procesamiento del nodo
- Error al actualizar el punto de conexión del clúster
- Error al eliminar la conexión no disponible del clúster de Kubernetes.
- Error al sincronizar el certificado de clúster
Adición de alarmas de umbral
A continuación se utiliza la alarma Workload CPU Usage como ejemplo para describir cómo agregar una alarma basada en umbral. También puede utilizar este método para agregar otras alarmas de umbral.
Esta función es proporcionada por AOM. Para obtener más información, consulte Personalización de reglas de umbral estático.
Puede configurar las alarmas de umbral de acuerdo con Tabla 2.

El uso de la CPU pod, el uso de la memoria física y las alarmas de uso del sistema de archivos deben configurarse para los componentes everest-csi-controller, everest-csi-driver, coredns, autoscaler y Yangtse. Actualice las especificaciones en el caso de un alto uso de recursos para evitar fallos del sistema.
| Recurso | Elemento de monitoreo | Descripción | Activador recomendado |
|---|---|---|---|
| Clúster | Uso de CPU | Esta métrica se utiliza para calcular el uso de la CPU del objeto medido. | Condición umbral: > 85%; periodo estadístico (minutos): 1; periodos consecutivos: 3 |
| Uso de disco | Esta métrica se utiliza para calcular el porcentaje del espacio en disco en uso con respecto al espacio total en disco. | Condición umbral: > 85%; periodo estadístico (minutos): 1; periodos consecutivos: 3 | |
| Uso de la memoria física | Esta métrica se utiliza para calcular el porcentaje de la memoria física utilizada por el objeto medido con respecto a la memoria física total. | Condición umbral: > 85%; periodo estadístico (minutos): 1; periodos consecutivos: 3 | |
| Uso de memoria virtual | Esta métrica se utiliza para calcular el porcentaje de la memoria virtual utilizada por el objeto medido con respecto a la memoria virtual total. | Condición umbral: > 85%; periodo estadístico (minutos): 1; periodos consecutivos: 3 | |
| Host | Uso de CPU | Esta métrica se utiliza para calcular el uso de la CPU del objeto medido. | Condición umbral: > 85%; periodo estadístico (minutos): 1; periodos consecutivos: 3 |
| Uso de la memoria física | Esta métrica se utiliza para calcular el porcentaje de la memoria física utilizada por el objeto medido con respecto a la memoria física total. | Condición umbral: > 85%; periodo estadístico (minutos): 1; periodos consecutivos: 3 | |
| Uso de memoria virtual | Esta métrica se utiliza para calcular el porcentaje de la memoria virtual utilizada por el objeto medido con respecto a la memoria virtual total. | Condición umbral: > 85%; periodo estadístico (minutos): 1; periodos consecutivos: 3 | |
| Red de host | Tasa de paquetes de errores recibidos | Esta métrica se utiliza para calcular el número de paquetes de error recibidos por una NIC por segundo. | Condición umbral: > 0; período estadístico (minutos): 1; períodos consecutivos: 3 |
| Tasa de paquetes de error de envío | Esta métrica se utiliza para calcular el número de paquetes de error enviados por una NIC por segundo. | Condición umbral: > 0; período estadístico (minutos): 1; períodos consecutivos: 3 | |
| Sistema de archivos de host | Uso de disco | Esta métrica se utiliza para calcular el porcentaje del espacio en disco en uso con respecto al espacio total en disco. | Condición umbral: > 85%; periodo estadístico (minutos): 1; periodos consecutivos: 3 |
| Estado de lectura/escritura del disco | Esta métrica se utiliza para recopilar estadísticas sobre el estado de lectura y escritura de discos en un host. | Condición umbral: >= 1; periodo estadístico (minutos): 1; periodos consecutivos: 1 | |
| Carga de trabajo | Estado de la carga de trabajo | Esta métrica se utiliza para comprobar el estado de la carga de trabajo anormal. | Condición umbral: >= 1; periodo estadístico (minutos): 1; periodos consecutivos: 1 |
| Uso de CPU | Esta métrica se usa para calcular el uso de la CPU del objeto medido, a saber, la relación de los núcleos de la CPU usados realmente por el objeto medido con respecto al total de núcleos de la CPU a los que el objeto medido ha aplicado. | Condición umbral: > 85%; periodo estadístico (minutos): 1; periodos consecutivos: 3 | |
| Uso de la memoria física | Esta métrica se utiliza para calcular el porcentaje de la memoria física utilizada por el objeto medido con respecto a la memoria física total. | Condición umbral: > 85%; periodo estadístico (minutos): 1; periodos consecutivos: 3 | |
| Uso del sistema de archivos | Esta métrica se utiliza para calcular el uso del sistema de archivos de un objeto medido, es decir, el porcentaje del sistema de archivos utilizado respecto al sistema de archivos total. Esta métrica solo se admite para contenedores mediante Device Mapper en el clúster de Kubernetes de la versión 1.11 o posterior. | Condición umbral: > 85%; periodo estadístico (minutos): 1; periodos consecutivos: 3 | |
| Pod | Uso de CPU | Esta métrica se usa para calcular el uso de la CPU del objeto medido, a saber, la relación de los núcleos de la CPU usados realmente por el objeto medido con respecto al total de núcleos de la CPU a los que el objeto medido ha aplicado. | Condición umbral: > 85%; periodo estadístico (minutos): 1; periodos consecutivos: 3 |
| Uso del sistema de archivos | Esta métrica se utiliza para calcular el uso del sistema de archivos de un objeto medido, es decir, el porcentaje del sistema de archivos utilizado respecto al sistema de archivos total. Esta métrica solo se admite para contenedores mediante Device Mapper en el clúster de Kubernetes de la versión 1.11 o posterior. | Condición umbral: > 85%; periodo estadístico (minutos): 1; periodos consecutivos: 3 | |
| Uso de la memoria física | Esta métrica se utiliza para calcular el porcentaje de la memoria física utilizada por el objeto medido con respecto a la memoria física total. | Condición umbral: > 85%; periodo estadístico (minutos): 1; periodos consecutivos: 3 | |
| Estado del contenedor | Esta métrica se utiliza para comprobar si el estado del contenedor de Docker es normal. | Condición umbral: >= 1; periodo estadístico (minutos): 1; periodos consecutivos: 1 | |
| Tasa de paquetes de errores recibidos | Esta métrica se utiliza para calcular el número de paquetes de error recibidos por una NIC por segundo. | Condición umbral: > 0; período estadístico (minutos): 1; períodos consecutivos: 3 | |
| Paquetes recibidos con errores | Esta métrica se utiliza para calcular el número de paquetes de error recibidos por un objeto medido | Condición umbral: > 0; período estadístico (minutos): 1; períodos consecutivos: 3 | |
| Tasa de paquetes de error de envío | Esta métrica se utiliza para calcular el número de paquetes de error enviados por una NIC por segundo. | Condición umbral: > 0; período estadístico (minutos): 1; períodos consecutivos: 3 |
- Inicie sesión en la consola de AOM.
- En el panel de navegación, elija Alarm Center > Alarm Rules y haga clic en Add Alarm.
- Establezca una regla de alarma.
- Rule Type: Seleccione Threshold Rule.
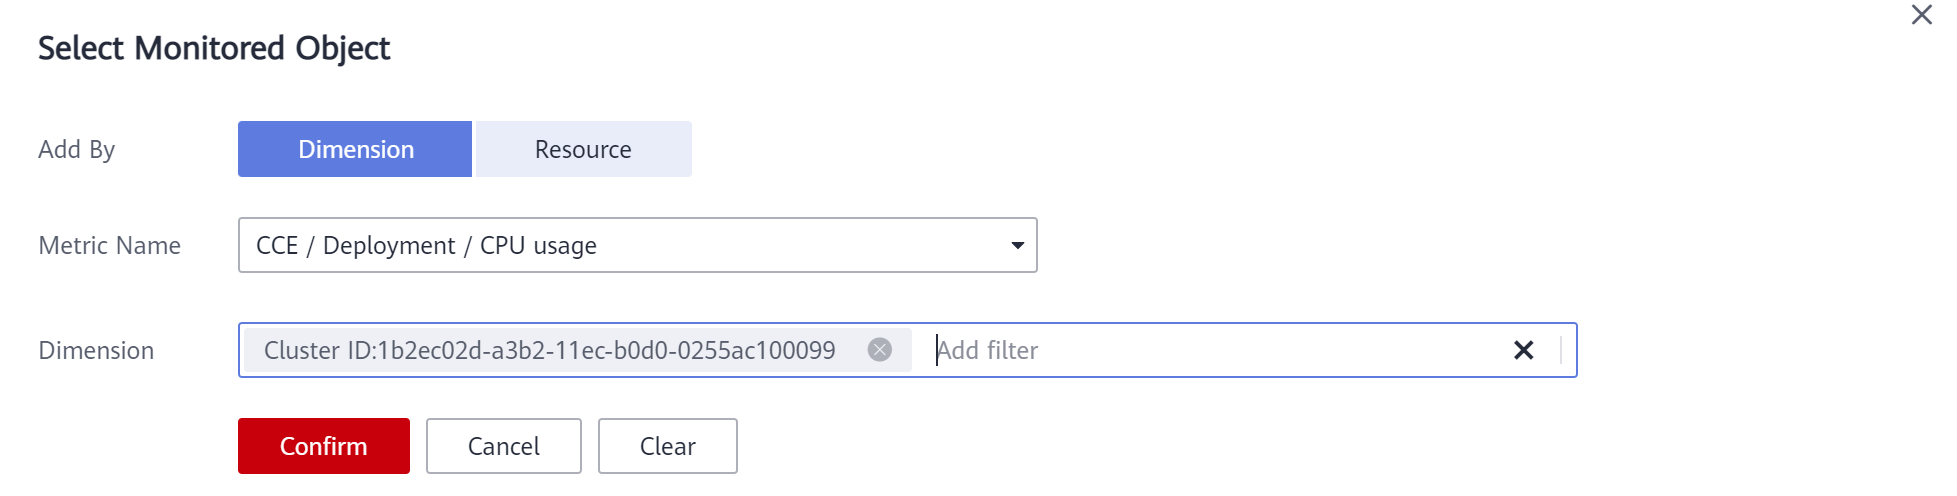
- Monitored Object: haga clic en Select resource objects, establezca Add By a Dimension y seleccione CCE/Deployment/CPU Usage para Metric Name. Puede filtrar los recursos por varias dimensiones según sea necesario.
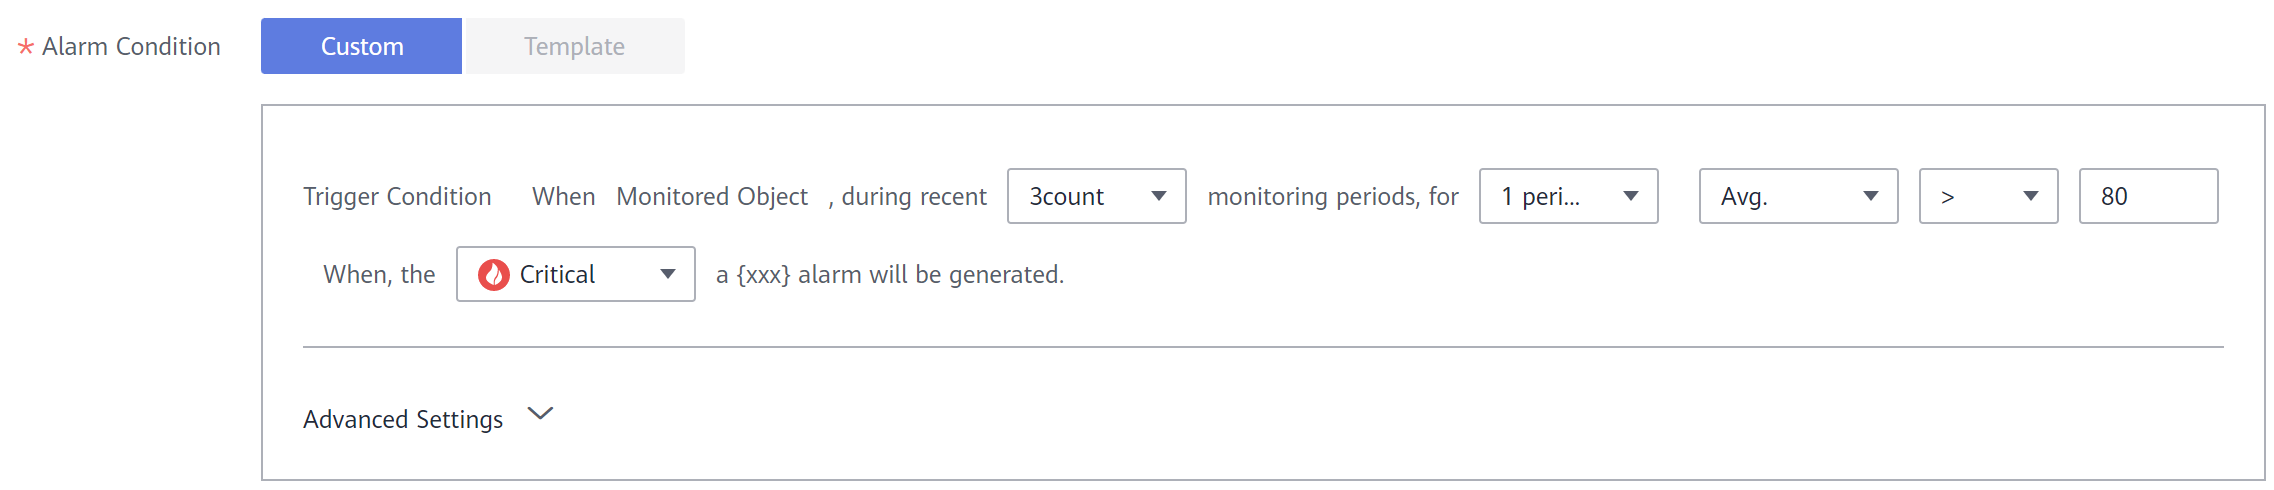
- Alarm Condition: Establezca parámetros como el período estadístico, los tiempos consecutivos y las condiciones de umbral según sea necesario.
- Triggering Mode: Seleccione Immediate Triggering.
- Alarm Mode: Seleccione Direct Alarm Reporting.
- Action Policy: seleccione la política de acción creada en Creación de una política de acción.
- Haga clic en Create Now.
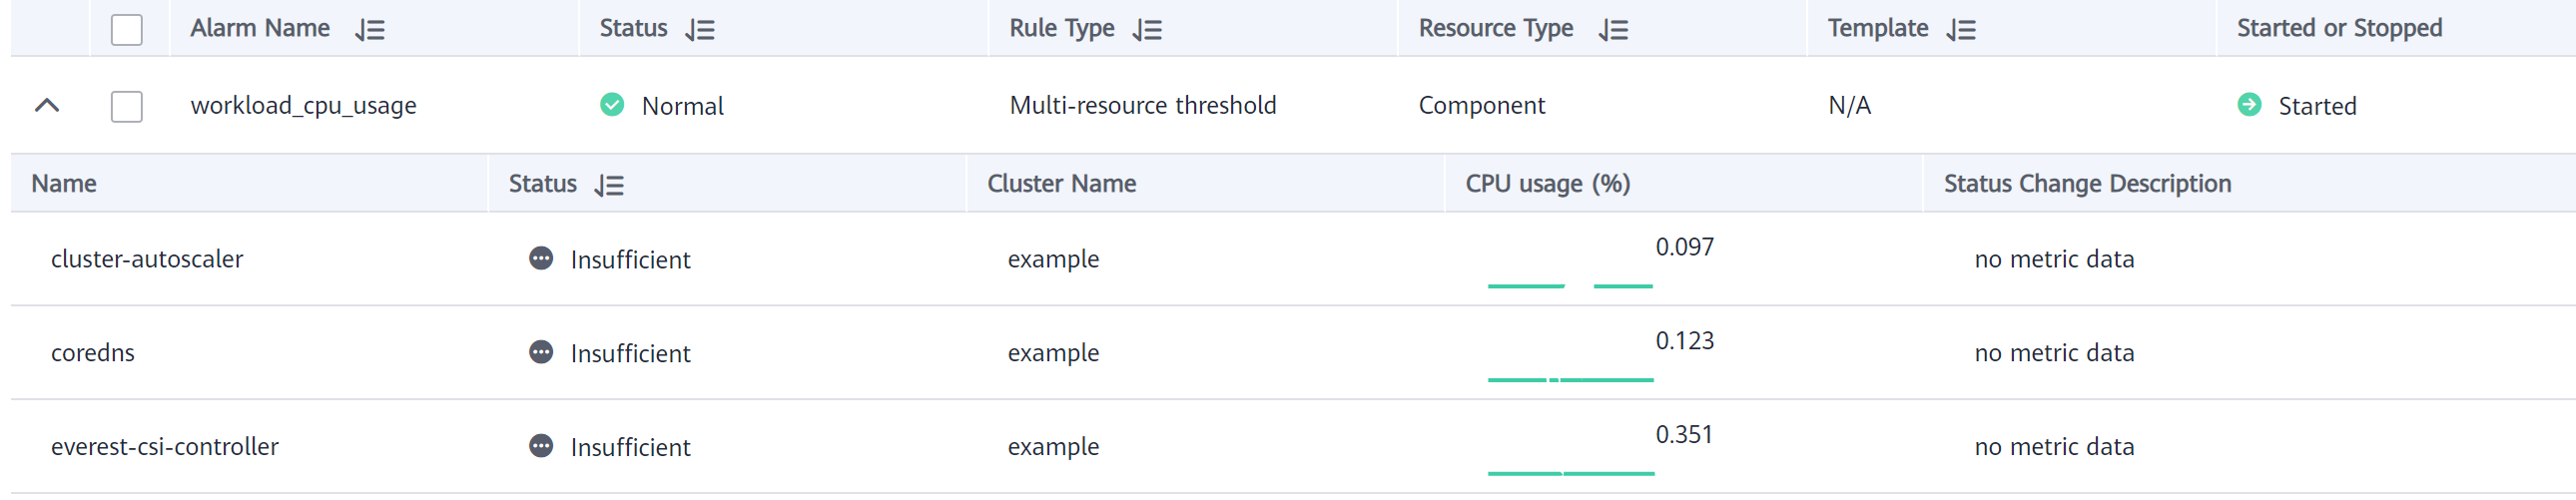
Si se muestra la siguiente información en la lista de reglas, la regla se crea correctamente. En este ejemplo, hay varias cargas de trabajo porque no se especifica ninguna carga de trabajo en los criterios de filtro. Por lo tanto, se muestran todas las cargas de trabajo del clúster.