Monitoring the Huawei Cloud Astro Zero System
Tenant Overview
On the tenant overview page, you can view the number of applications, number of users, and license control statistics of the current tenant.
- Log in to the Huawei Cloud Astro Zero console and click Access Homepage. The application development page is displayed.
- In the upper left corner of the page, click
 and choose Environments > Environment Configuration.
 - Choose Monitoring from the main menu.
- In the navigation pane, choose Monitoring Dashboard > Overview to view the current tenant's resources, including license control statistics, applications, and users.
License control statistics are displayed only in the environment configuration of the Huawei Cloud Astro Zero runtime environment.
- Overview
Displays the number of users, applications, scheduled tasks, and connectors that have been added or installed under the current account.
- License control item statistics
Collects statistics on the license control items of the current account. Each statistical item corresponds to each resource item under Config > Setup > Resource Quotas. The statistical items are used to intuitively display the resource usage and maximum quota of the current account.
- Overview
Tenant Dashboard
On the tenant dashboard, you can view the alarm information, page access information, API call information, and deployment statistics of the current tenant.
- On the Huawei Cloud Astro Zero console, click Manage Runtime Environment of the purchased commercial instance to access the production environment.
- Choose Monitoring from the main menu.
- In the navigation pane, choose Monitor Dashboard > Tenant Dashboard.
- Set the statistical period. Data is grouped as follows:
- Within 1 hour: Grouped by minute
- Within 1 day: Grouped by hour
- Within 1 month: Grouped by day
- On the Alarm Statistics tab page, view all alarms in the current environment.
- On the Page Access Statistics tab page, view the access statistics of all pages in the current environment.
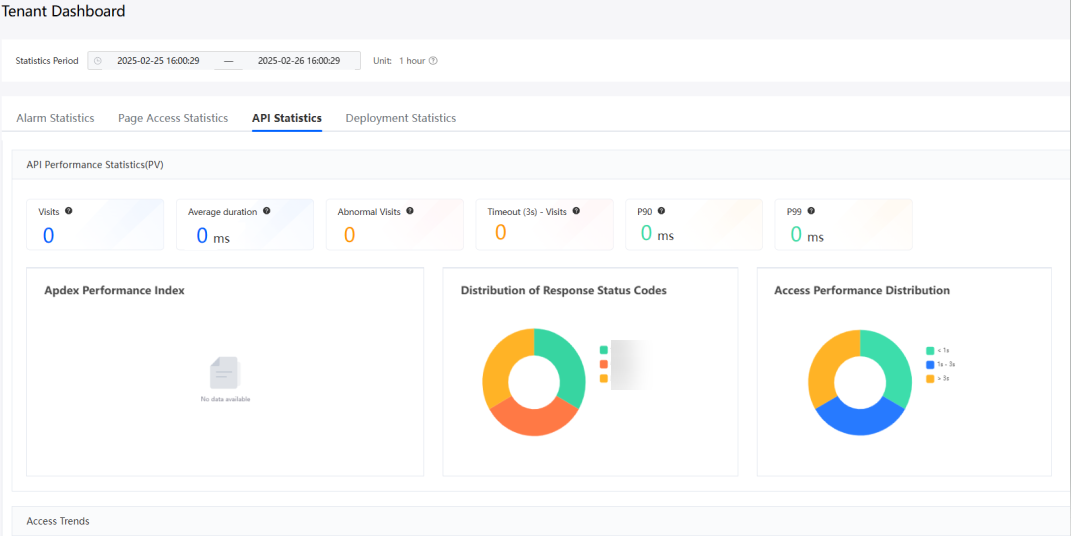
- On the API Statistics tab page, view the API calling information.
Figure 1 API call statistics

Table 1 Parameters on the API call statistics page Area
Parameter
Description
API performance statistics
Visits
Total access volume in a statistical period.
Average duration
Average response duration of all access requests in a statistical period.
Abnormal Visits
Number of access requests whose response status codes are 4 XX and 5 XX in a statistical period.
Timeout (3s) - Visits
Total number of access requests whose response duration exceeds 3 seconds in a statistical period.
P90
90% of the access response durations in the selected period are less than the value of this parameter.
P99
99% of the access response durations in the selected period are less than the value of this parameter.
Apdex Performance Index
Application Performance Index (Apdex) measures user satisfaction with application performance through a quantized value. The calculation formula is:
If the API response delay is 0–1 second, users are satisfied. If it is 1–3 seconds, it is tolerable. If it is over 3 seconds or the request fails, it is unacceptable. The Apdex score is calculated as: (Satisfied requests + 0.5 × Tolerable requests)/Total requests.
Distribution of Response Status Codes
Collects statistics on response status codes in a pie chart, including the number of successful requests, client-side failed requests, and server-side failed requests.
Access Performance Distribution
Collects statistics on access performance in pie charts. The statistical data is 0 to 1 second, 1 to 3 seconds, and longer than 3 seconds.
Access Trends
Total requests & Average response duration
- Total requests: total number of API requests released in the applications and BOs of the account.
- Average response duration: average response duration of APIs in each time segment.
Request Status Distribution
Request status distribution in each time segment, including the number of successful requests, client-side failures, and server-side failures.
Request Duration Distribution
Request duration distribution in each time segment. The request duration ranges from 0 to 1 second, from 1 to 3 seconds, and greater than 3 seconds.
Top 20 applications/Top 20 interfaces
Application name (statistical dimension of top 20 applications)
Specific application of the request.
Request interface (statistical dimension of top 20 interfaces)
Request interface.
Times
Total number of interface calls in a statistical period.
Client Failures
Number of clients that fail to invoke interfaces in a statistical period.
Server Failures
Number of times that the interface fails to be invoked by the server in a statistical period.
Success Rate
API request success rate in a statistical period. The value is calculated as follows: Number of successful API requests/Total number of API requests.
- Number of successful API requests: number of successful API requests released in the app and BO of the account.
- Total number of API requests: total number of API requests published in the app and BO of the account.
Request TPM
Transaction per minute (TPM) indicates the number of requests processed per second.
Average Delay (ms)
Average API call delay.
Unit: ms
P90 Delay (ms)
The response delay values are sorted in ascending order. The value at 90% is the P99 value.
Unit: ms
P99 Delay (ms)
The response delays are sorted in ascending order. The value at the 99% position is the P99 value.
Unit: ms
If no result is returned within the time specified by P99 or P90, there is a high probability that the request is a slow request.
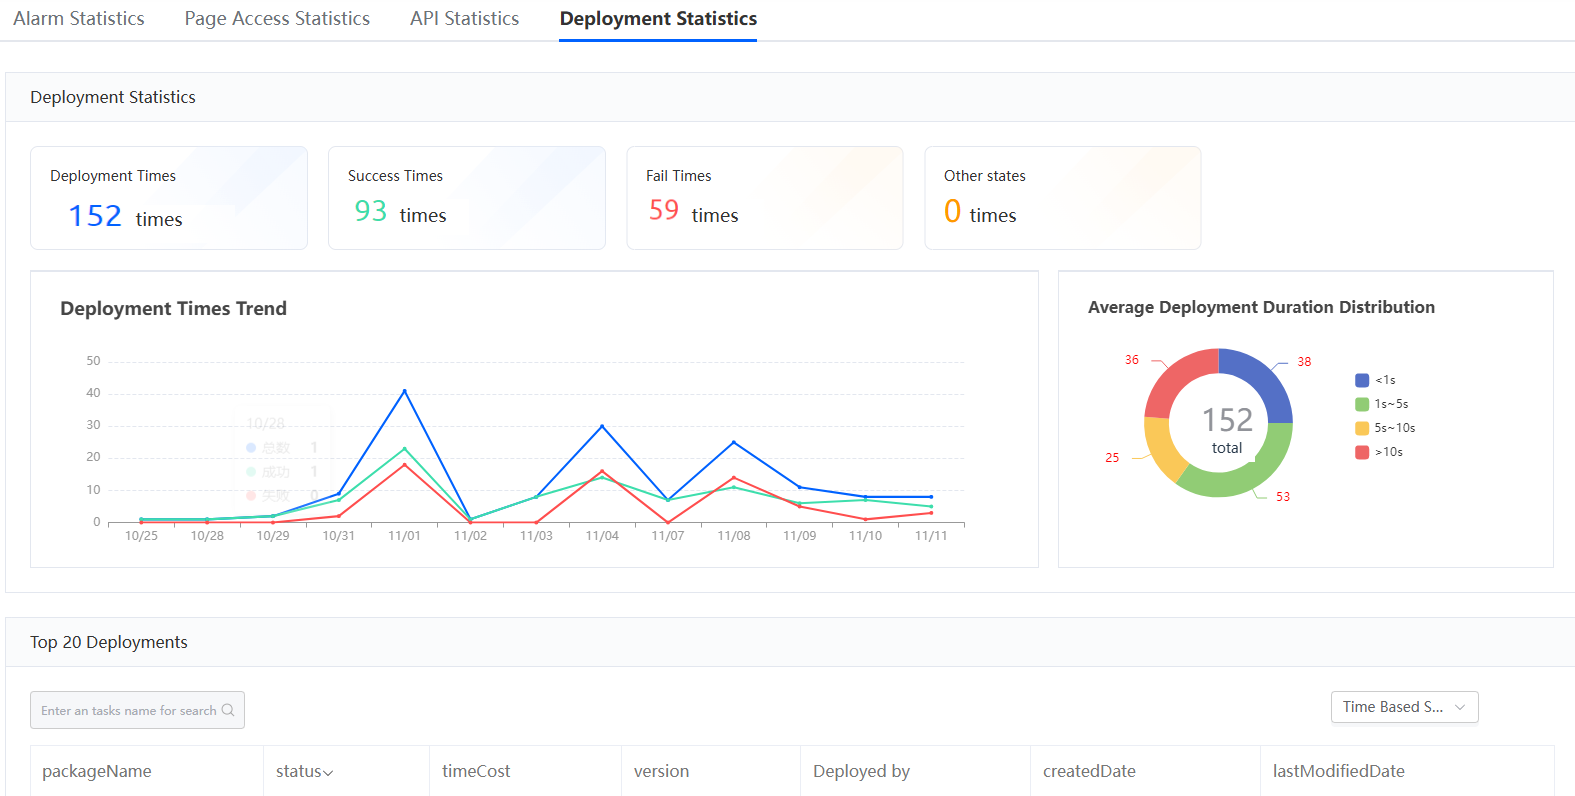
- On the deployment statistics tab page, view all deployment statistics of the tenant.
Figure 2 Tenant dashboard deployment statistics

Application Dashboard
On the application dashboard, you can view alarm statistics, service access statistics, and API statistics.
- On the Huawei Cloud Astro Zero console, click Manage Runtime Environment of the purchased commercial instance to access the production environment.
- Choose Monitoring from the main menu.
- In the navigation pane, choose Monitoring Dashboard > Application Dashboard.
- On the alarm statistics tab page, alarm summary information is collected by application. Alarms can be sorted by the total number of alarms.
- On the Page Access Statistics tab page, collect statistics on page access information by app. The statistics can be sorted by user count (UV), page view (PV), and average loading duration.
- On the API Statistics tab page, view the API calling information.
Feedback
Was this page helpful?
Provide feedbackThank you very much for your feedback. We will continue working to improve the documentation.See the reply and handling status in My Cloud VOC.
For any further questions, feel free to contact us through the chatbot.
Chatbot


