Method Analysis
Method analysis shows the time consumption details, invocation source, and source code of running methods. This helps you quickly locate root causes in scenarios where faults cannot be reproduced offline or logs are missing.
Procedure
- Log in to the APM console.
- Click
 on the left and choose Management & Governance > Application Performance Management.
 - In the navigation pane, choose Application Monitoring > Metrics.
- In the tree on the left, click
 next to the target environment.
 - Click the Debugging Diagnosis tab.
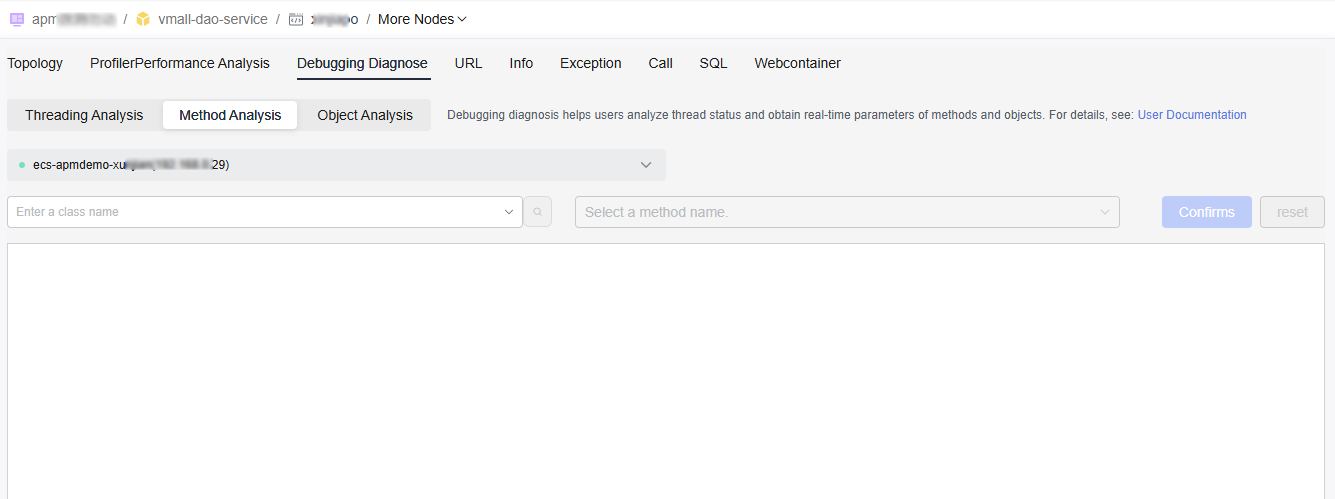
- Click Method Analysis. The Method Analysis page is displayed.
Figure 1 Method analysis

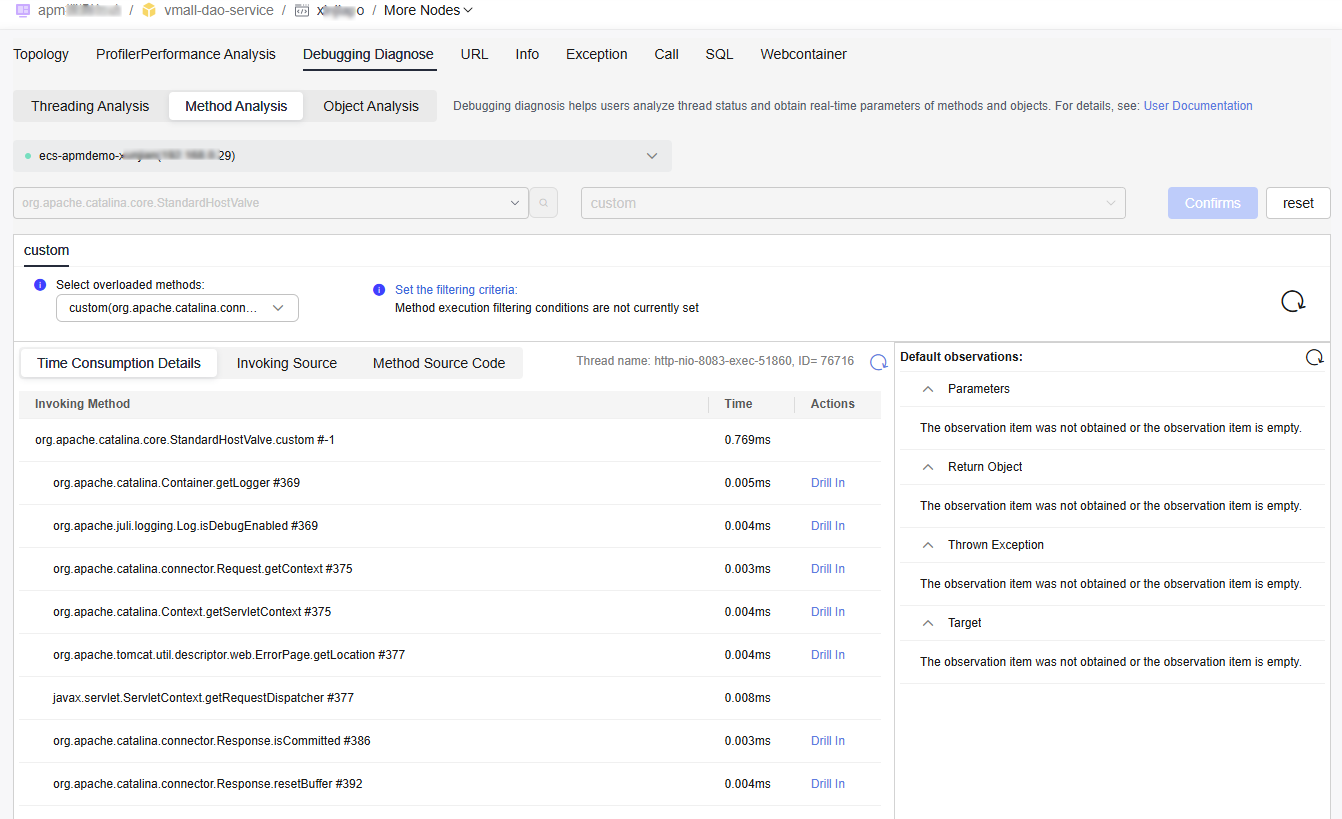
- In the Enter a class name text box, enter a class name. Click
 and select a class name from the drop-down list.
In the Select a method name text box, select a method name. Click Confirm. The execution information of the method is displayed.
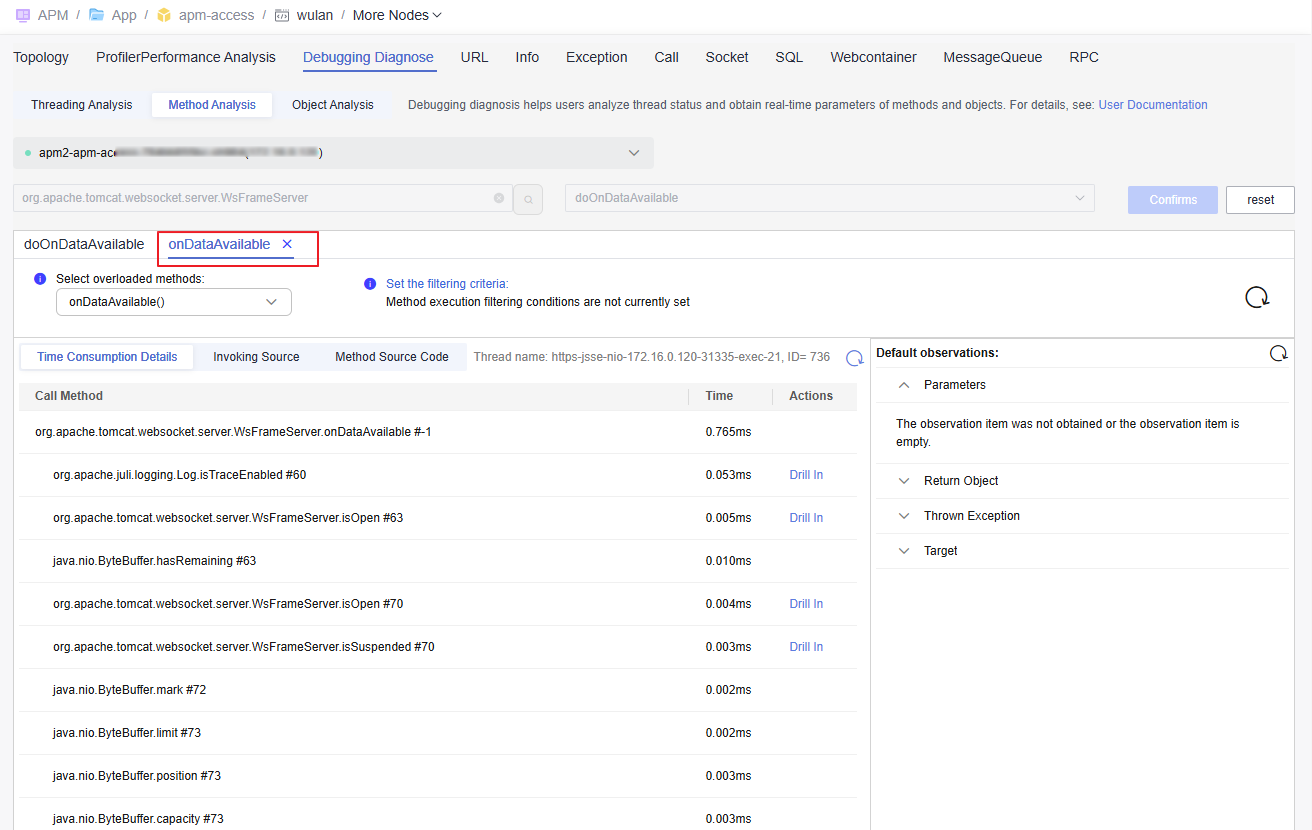
Figure 2 Class name and method name Figure 3 Method analysis details
- The execution records of the method are displayed on the left of the page, including Time Consumption Details, Invoking Source, and Method Source Code.
- Time Consumption Details: include the call method, time consumed, and drill-in operation.
- Click Drill In to view details about the called method.
Figure 4 Drill-down

- Default observation items are displayed on the right of the page, including Parameters, Return Object, Thrown Exception, and Target.
- Select overloaded methods: In the drop-down list, select an overloaded method.
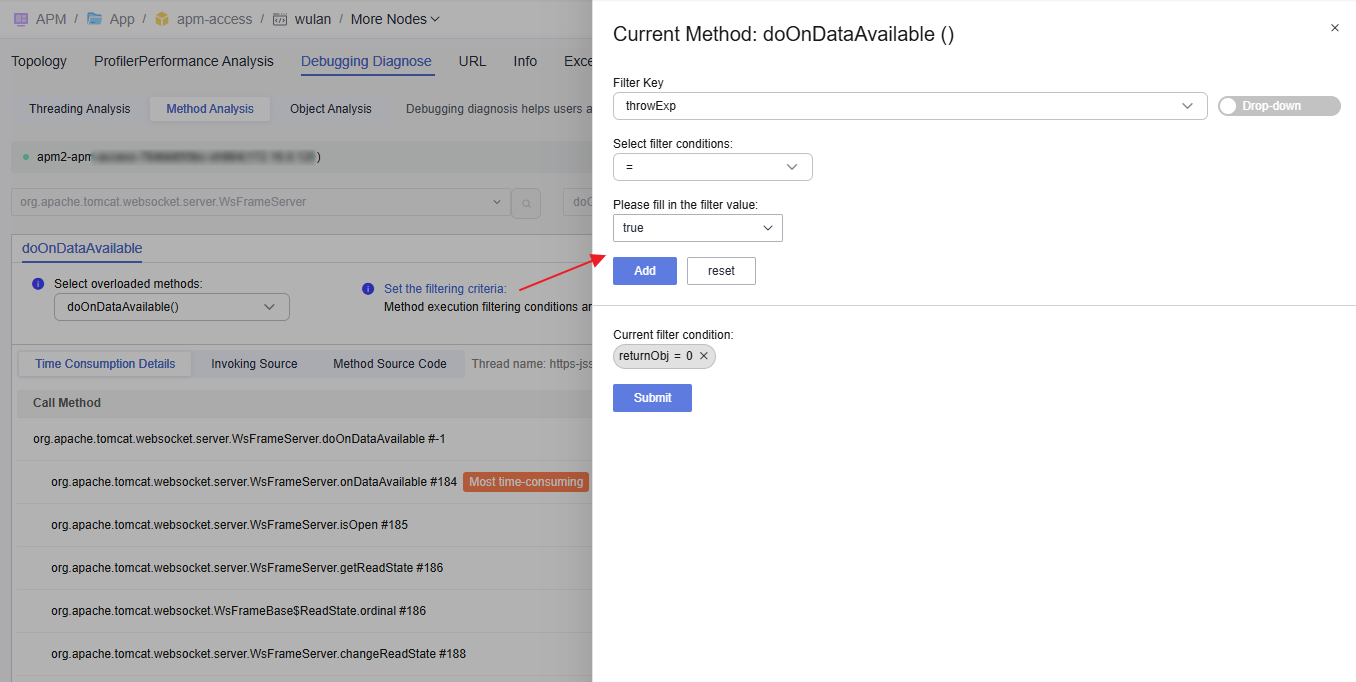
- Set the filtering criteria: Filter method records that meet specified criteria.
Figure 5 Setting the filtering criteria

- Select a filter key from the drop-down list or enter one.
- Select a filter criterion from the drop-down list.
- Enter a filter value.
- Click Add. The filter criteria will be displayed in the current dialog box.
- Click Submit to complete the configuration.
- The execution records of the method are displayed on the left of the page, including Time Consumption Details, Invoking Source, and Method Source Code.
Feedback
Was this page helpful?
Provide feedbackThank you very much for your feedback. We will continue working to improve the documentation.See the reply and handling status in My Cloud VOC.
For any further questions, feel free to contact us through the chatbot.
Chatbot


