El contenido no se encuentra disponible en el idioma seleccionado. Estamos trabajando continuamente para agregar más idiomas. Gracias por su apoyo.

Compute
Elastic Cloud Server
Huawei Cloud Flexus
Bare Metal Server
Auto Scaling
Image Management Service
Dedicated Host
FunctionGraph
Cloud Phone Host
Huawei Cloud EulerOS
Networking
Virtual Private Cloud
Elastic IP
Elastic Load Balance
NAT Gateway
Direct Connect
Virtual Private Network
VPC Endpoint
Cloud Connect
Enterprise Router
Enterprise Switch
Global Accelerator
Management & Governance
Cloud Eye
Identity and Access Management
Cloud Trace Service
Resource Formation Service
Tag Management Service
Log Tank Service
Config
OneAccess
Resource Access Manager
Simple Message Notification
Application Performance Management
Application Operations Management
Organizations
Optimization Advisor
IAM Identity Center
Cloud Operations Center
Resource Governance Center
Migration
Server Migration Service
Object Storage Migration Service
Cloud Data Migration
Migration Center
Cloud Ecosystem
KooGallery
Partner Center
User Support
My Account
Billing Center
Cost Center
Resource Center
Enterprise Management
Service Tickets
HUAWEI CLOUD (International) FAQs
ICP Filing
Support Plans
My Credentials
Customer Operation Capabilities
Partner Support Plans
Professional Services
Analytics
MapReduce Service
Data Lake Insight
CloudTable Service
Cloud Search Service
Data Lake Visualization
Data Ingestion Service
GaussDB(DWS)
DataArts Studio
Data Lake Factory
DataArts Lake Formation
IoT
IoT Device Access
Others
Product Pricing Details
System Permissions
Console Quick Start
Common FAQs
Instructions for Associating with a HUAWEI CLOUD Partner
Message Center
Security & Compliance
Security Technologies and Applications
Web Application Firewall
Host Security Service
Cloud Firewall
SecMaster
Anti-DDoS Service
Data Encryption Workshop
Database Security Service
Cloud Bastion Host
Data Security Center
Cloud Certificate Manager
Edge Security
Blockchain
Blockchain Service
Web3 Node Engine Service
Media Services
Media Processing Center
Video On Demand
Live
SparkRTC
MetaStudio
Storage
Object Storage Service
Elastic Volume Service
Cloud Backup and Recovery
Storage Disaster Recovery Service
Scalable File Service Turbo
Scalable File Service
Volume Backup Service
Cloud Server Backup Service
Data Express Service
Dedicated Distributed Storage Service
Containers
Cloud Container Engine
SoftWare Repository for Container
Application Service Mesh
Ubiquitous Cloud Native Service
Cloud Container Instance
Databases
Relational Database Service
Document Database Service
Data Admin Service
Data Replication Service
GeminiDB
GaussDB
Distributed Database Middleware
Database and Application Migration UGO
TaurusDB
Middleware
Distributed Cache Service
API Gateway
Distributed Message Service for Kafka
Distributed Message Service for RabbitMQ
Distributed Message Service for RocketMQ
Cloud Service Engine
Multi-Site High Availability Service
EventGrid
Dedicated Cloud
Dedicated Computing Cluster
Business Applications
Workspace
ROMA Connect
Message & SMS
Domain Name Service
Edge Data Center Management
Meeting
AI
Face Recognition Service
Graph Engine Service
Content Moderation
Image Recognition
Optical Character Recognition
ModelArts
ImageSearch
Conversational Bot Service
Speech Interaction Service
Huawei HiLens
Video Intelligent Analysis Service
Developer Tools
SDK Developer Guide
API Request Signing Guide
Terraform
Koo Command Line Interface
Content Delivery & Edge Computing
Content Delivery Network
Intelligent EdgeFabric
CloudPond
Intelligent EdgeCloud
Solutions
SAP Cloud
High Performance Computing
Developer Services
ServiceStage
CodeArts
CodeArts PerfTest
CodeArts Req
CodeArts Pipeline
CodeArts Build
CodeArts Deploy
CodeArts Artifact
CodeArts TestPlan
CodeArts Check
CodeArts Repo
Cloud Application Engine
MacroVerse aPaaS
KooMessage
KooPhone
KooDrive
Help Center/ Live/ Cloud Live/ Monitoring and Alarms

Monitoring and Alarms

Updated on 2024-12-06 GMT+08:00

Live has been interconnected with Cloud Eye, where you can use the console or APIs to query monitoring metrics and alarm information of ingest domain names and streaming domain names.

NOTICE:
  • If you use a custom policy but do not use the system-defined permissions Live FullAccess and Live ReadOnlyAccess, you need to add the operation permission live:tenant:getTenantInformation before accessing the Live console.
  • After assigning an IAM user the Live FullAccess permission, you need to assign the user the following Cloud Eye permissions to monitor metrics of Live:
    • CES ReadOnlyAccess: On the Cloud Eye console, choose Cloud Service Monitoring > Live to view resource monitoring metrics of Live.
    • CES FullAccess: On the Cloud Eye console, choose Cloud Service Monitoring > Live to view resource monitoring metrics of Live and perform operations.

Namespaces

SYS.Live

Monitoring Metrics

Table 1 Monitoring metrics of online user count and playback bandwidth

ID

Name

Description

Value Range

Monitored Object

Monitoring Period of Raw Data (Minute)

online

Play concurrency number

Queries the number of online users in a livestream.

≥ 0

Streaming domain name

1

bandwidth

Play bandwidth

Queries the bandwidth data of a streaming domain name.

Unit: bit/s

≥ 0 bits/s

Streaming domain name

1

play_traffic

Play traffic

Queries the playback traffic.

Unit: bit

≥ 0 bits

Streaming domain name

1

qps

QPS

Queries the number of queries per second.

≥ 0

Streaming domain name

1

http_4xx_proportion

4xx status code proportion

Queries the proportion of 4xx status codes.

0-100%

Streaming domain name

1

http_5xx_proportion

5xx status code proportion

Queries the proportion of 5xx status codes.

0–100%

Streaming domain name

1

inject_concurrency_number

inject_concurrency_number

Queries the number of concurrent pushed streams.

≥ 0

Ingest domain name

1

inject_bandwidth

Inject bandwidth

Queries the streaming bandwidth.

Unit: bit/s

≥ 0 bits/s

Ingest domain name

1

Dimensions

Key

Value

domain

Streaming domain name and ingest domain name

Viewing My Dashboards

You can create a dashboard.

Viewing Cloud Service Dashboards

Cloud service dashboards allow you to view cloud service monitoring data. Data of a cloud service is displayed on one monitoring dashboard. A cloud service dashboard is automatically generated and does not need to be configured.

To view cloud service dashboards, perform the following operations:

  1. Log in to the console.
  1. Choose All Services > Cloud Eye.
  2. In the navigation pane on the left, choose Cloud Service Monitoring.
  3. Click the dashboard name Live LIVE. The Details page is displayed.
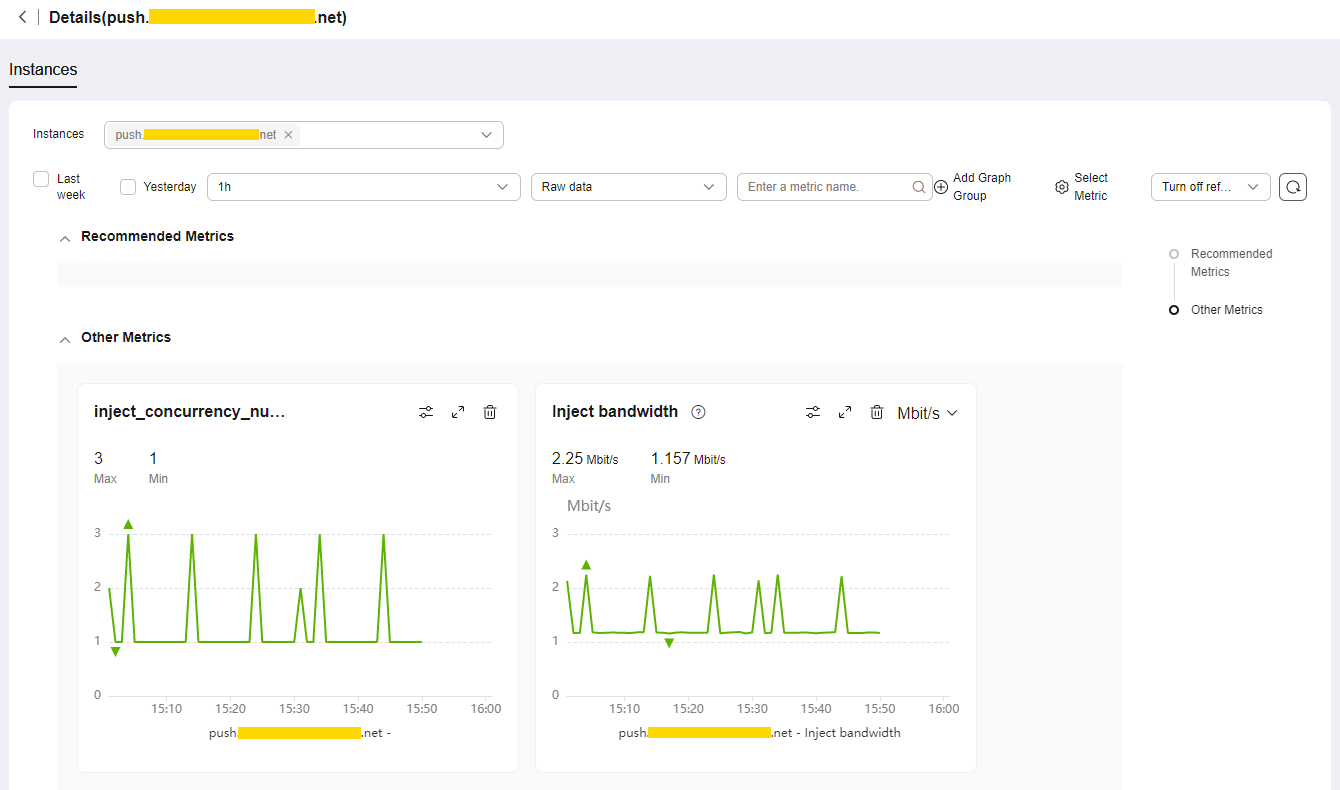
  4. Click the Resources tab. In the Operation column of the desired resource, click View Metric. The Instances tab on the Details page is displayed.
    View monitoring metric details, as shown in Figure 1.
    Figure 1 Monitoring metric details

Creating an Alarm Rule

You can create an alarm rule to customize monitored objects and notification policies, so that you can be well-informed of the Live service status.

  1. Log in to the console.
  1. Choose All Services > Cloud Eye.
  2. In the navigation pane on the left, choose Cloud Service Monitoring.
  3. Click the dashboard name Live LIVE. The Details page is displayed.
  4. Click the Resources tab. In the Operation column of the desired resource, click More > Create Alarm Rule. The Create Alarm Rule page is displayed.

    Configure parameters by referring to Creating an Alarm Rule.

  5. Click Create.

    After the alarm rule is created, the system automatically notifies you when an alarm is triggered.

Utilizamos cookies para mejorar nuestro sitio y tu experiencia. Al continuar navegando en nuestro sitio, tú aceptas nuestra política de cookies. Descubre más

Feedback

Feedback

Feedback

0/500

Selected Content

Submit selected content with the feedback