
Quality Reports - Project Dashboards
The project dashboard displays the requirement coverage rate, defects, test case pass rate, and test case completion rate corresponding to the test case library and test plan, as well as detailed information such as defects associated with the test cases.
Quality Report of the Test Case Library
Log in to the CodeArts homepage and search for and access the target project. In the navigation pane, choose Testing > Quality Report. The Quality Report page is displayed by default.
Report Item |
Description |
|---|---|
Requirement Coverage |
Percentage of tested requirements in the selected sprint and module. This reflects function test coverage.
NOTE:
In Scrum projects, only statistics on the Feature and Story requirements are collected by default. To collect statistics on the Epic requirements, select epic. |
Defects |
Collects statistics on the number of unresolved defects and the total number of defects in the selected sprint and module. The statistics are grouped by defect severity.
NOTE:
The number of unresolved defects includes the following:
|
Case Pass Rate |
Pass rate of test cases in the selected sprint and module. The test case pass rate and defects reflect the overall product quality. The statistics are grouped based on the execution result. The test cases that are not executed are included in the Not executed group. Case pass rate = Number of successful test cases/Total number of test cases |
Manual Test |
Collects statistics on the requirement coverage rate, total number of defects, case pass rate, and case completion rate associated with manual test cases in the selected sprint and module. |
Auto API Test |
Collects statistics on the requirement coverage rate, total number of defects, case pass rate, and case completion rate associated with API automation test cases in the selected sprint and module. |
Defect List |
List of defects associated with test cases in the selected sprint and module. Click |
Test Case List |
List of test cases in the selected sprint and module. Click |


Quality Report of a Test Plan
On the Quality Report page, click the Test case Library drop-down list in the upper left corner and select a test plan. The quality report page of the selected test plan is displayed.
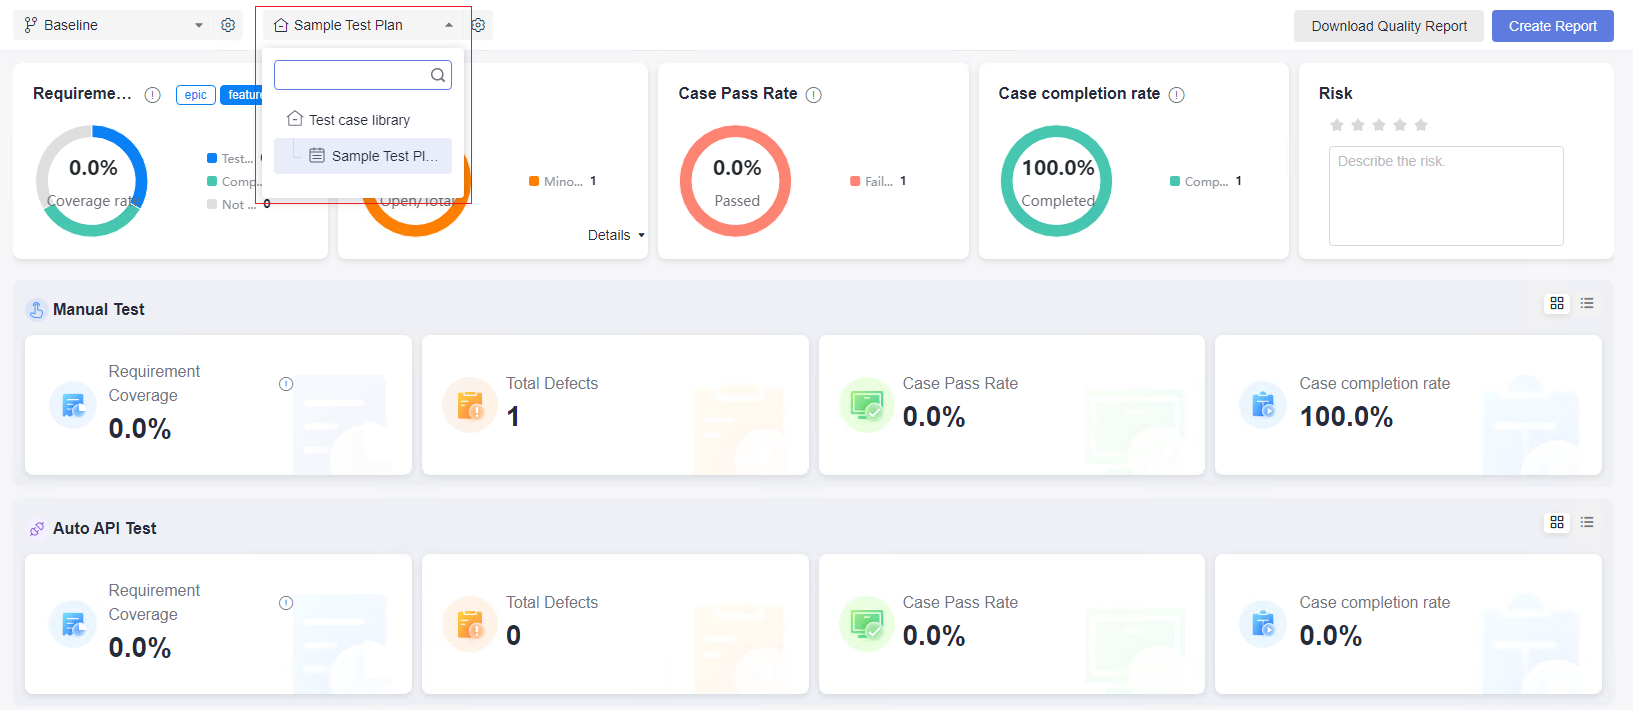
The quality report of a test plan is not filtered by sprint or module. In addition, it shows the test case completion rate and the risk description of the test plan. Other report items are the same as those of Quality Report of the Test Case Library.
Report Item |
Description |
|---|---|
Case Completion Rate |
Number of completed test cases in the selected plan. This reflects the test progress. The statistics are grouped by case status. Completion rate = Number of completed cases/Total number of cases |
Risk |
Risk of the test plan. You can evaluate the risk level of the test plan and add risk description. |
Manual Test |
Requirement coverage rate, total number of defects, and pass rate of manual test cases. |
Auto API Test |
Total number of defects, pass rate, and completion rate of API automation test cases. |
Feedback
Was this page helpful?
Provide feedbackThank you very much for your feedback. We will continue working to improve the documentation.See the reply and handling status in My Cloud VOC.
For any further questions, feel free to contact us through the chatbot.
Chatbot


