Vulnerable Assets Screen
Scenarios
There are always such scenarios as presentation, reporting, or real-time monitoring where you need to present the analysis results of SecMaster on big screens to achieve better demonstration effect. It is not ideal to just zoom in the console. Now, SecMaster Large Screen is a good choice for you to display the service console on bigger screens for a better visual effect.
By default, SecMaster provides a vulnerability situation screen. With this screen, you can view the overview of vulnerable assets, asset vulnerabilities, unsafe baseline settings, and unprotected assets.
Prerequisites
You have enabled Large Screen. For details, see Buying Value-Added Packages.
Viewing the Vulnerable Assets Screen
- Log in to the SecMaster console.
- Click
 in the upper left corner of the management console and select a region or project.
 - In the navigation pane on the left, choose Workspaces > Management. In the workspace list, click the name of the target workspace.Figure 1 Workspace management page

- In the navigation pane on the left, choose Situation Awareness > Large Screen.Figure 2 Large Screen

- Click Play in the lower right corner of the vulnerable assets image to access the screen.
This screen includes many graphs. More details are provided below.
Vulnerable Assets Overview
This graph displays the total numbers of vulnerable assets, vulnerabilities, unsafe baseline settings, and unprotected assets. Figure 3 shows an example.
Vulnerable assets refer to assets with unhandled vulnerabilities or unsafe baseline settings and assets that are not under protection at the current time.
Parameter | Statistical Period | Update Frequency | Description |
|---|---|---|---|
Vulnerable Assets | Real-time | Hourly | The number of assets with vulnerabilities or risky baseline settings. |
Vulnerabilities | Real-time | Hourly | Vulnerabilities collected in Vulnerabilities. |
Risky Baseline Settings | Real-time | Hourly | Data reported by Baseline Inspection in SecMaster. |
Unprotected Assets | Real-time | Hourly | Number of assets for which you need to enable security protection, for example, ECSs for which HSS is not enabled and EIPs for which DDoS is not enabled. |
Top 5 Departments with the Most Vulnerabilities
This graph shows the five departments with the most vulnerabilities. You will view the details of these departments, including the department name, number of vulnerable assets, number of unfixed vulnerabilities, and number of unprotected assets. Figure 4 shows an example.
Parameter | Statistical Period | Update Frequency | Description |
|---|---|---|---|
Top 5 Vulnerable Departments | Real-time | Hourly | The five departments have the most vulnerable assets, assets affected by vulnerabilities, and unprotected assets. Vulnerable assets include assets affected by vulnerabilities in Risk Prevention > Vulnerabilities, and assets that fail any check in Risk Prevention > Baseline Inspection, and assets that are not protected in Resource Manager. Note that the assets in Resource Manager must have department details provided, or they cannot be counted in calculation. |
Top 5 Department with the Most Unprotected Assets
This graph displays the five departments with the most failed protection policies. You can view the details about these departments, including the department name and what protection policies they failed, such as DBSS, WAF, Anti-DDoS, HSS, and CFW. Figure 5 shows an example.
The graph displays the five departments with the most unprotected assets.
Parameter | Statistical Period | Update Frequency | Description |
|---|---|---|---|
Top 5 Department with the Most Unprotected Assets | Real-time | Hourly | The five departments with the most unprotected assets. |
Vulnerability Fix Rate
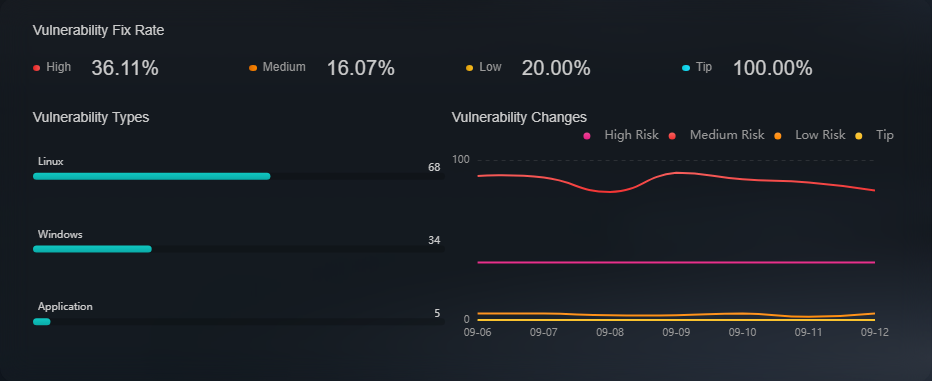
This graph shows the vulnerability fix rate, top 5 vulnerability types, and vulnerability trend changes. Figure 6 shows an example.
Parameter | Statistical Period | Update Frequency | Description |
|---|---|---|---|
Vulnerability Fix Rate | Real-time | Hourly | Vulnerability fixing rate =(Number of fixed vulnerabilities/Total number of vulnerabilities) x 100%. If no vulnerability exists, 100% is displayed. |
Vulnerability Types | Real-time | Hourly | Vulnerabilities are displayed by vulnerability type. |
Vulnerability Changes | Last 7 days | Hourly | Vulnerabilities in the last seven days are classified and counted by severity. |
Baseline Inspection Pass Rate
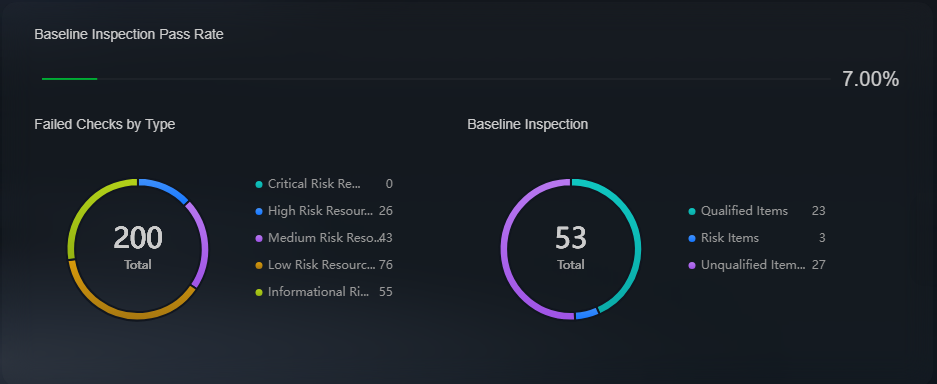
You can learn about baseline inspection results at a glance, including the pass rate, what resources have failed the inspection, failed checks, resource types, and the number of total check items. Figure 7 shows an example.
Parameter | Statistical Period | Update Frequency | Description |
|---|---|---|---|
Baseline Inspection Pass Rate | Real-time | Hourly | Baseline check pass rate =(Number of passed baseline check items/Total number of check items) x 100%. |
Failed Checks By Type | Real-time | Hourly | Failed baseline check items are displayed by risk severity. |
Baseline Inspection | Real-time | Hourly | This graph shows how many qualified, risky, and unqualified settings, respectively, discovered by baseline inspection. |
Feedback
Was this page helpful?
Provide feedbackThank you very much for your feedback. We will continue working to improve the documentation.See the reply and handling status in My Cloud VOC.
For any further questions, feel free to contact us through the chatbot.
Chatbot


