
Updated on 2024-11-21 GMT+08:00
Tables
The query and analysis results can be displayed in a table.
Table is the most commonly used method to display and analyze data. In SecMaster, the data results obtained by querying and analyzing statements are displayed in tables by default.
Procedure
- Log in to the management console.
- Click
 in the upper left corner of the management console and select a region or project.
 - Click
 in the upper left corner of the page and choose Security & Compliance > SecMaster.
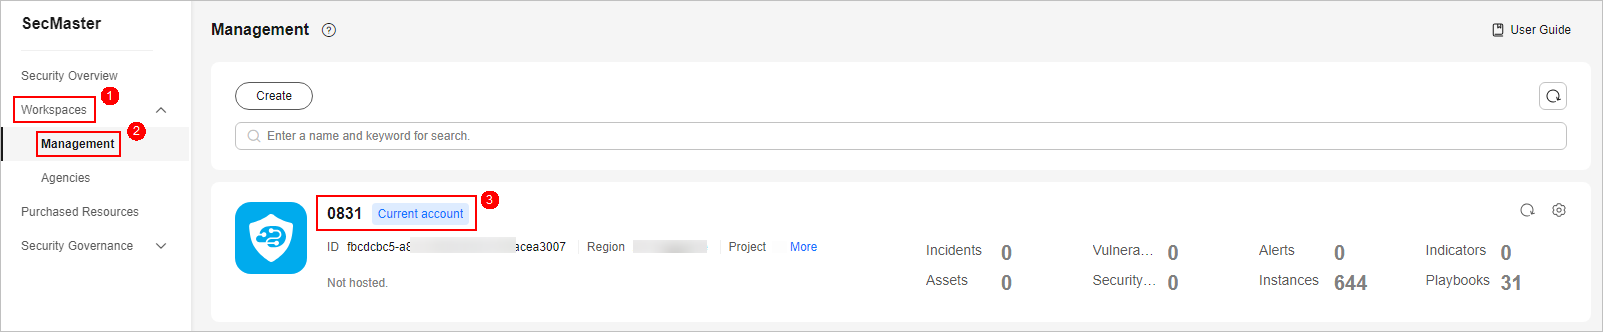
 - In the navigation pane on the left, choose Workspaces > Management. In the workspace list, click the name of the target workspace.
Figure 1 Workspace management page
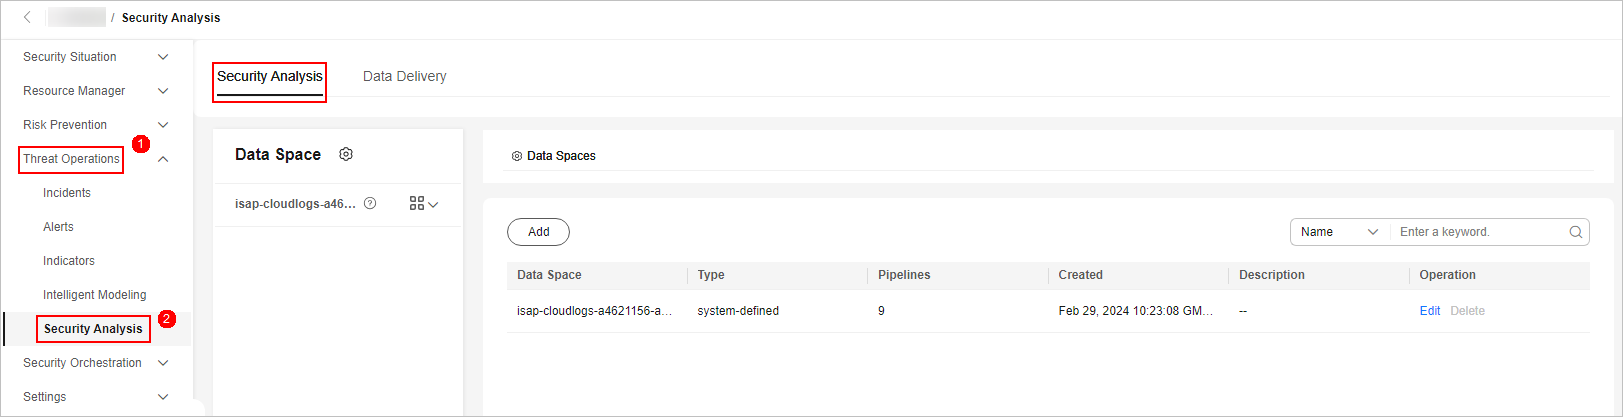
- In the navigation pane on the left, choose . The security analysis page is displayed.
Figure 2 Accessing the Security Analysis tab page
- In the data space navigation tree on the left, click a data space name to show the pipeline list. Click a pipeline name. On the displayed page, you can search the pipeline data.
Figure 3 Pipeline data page
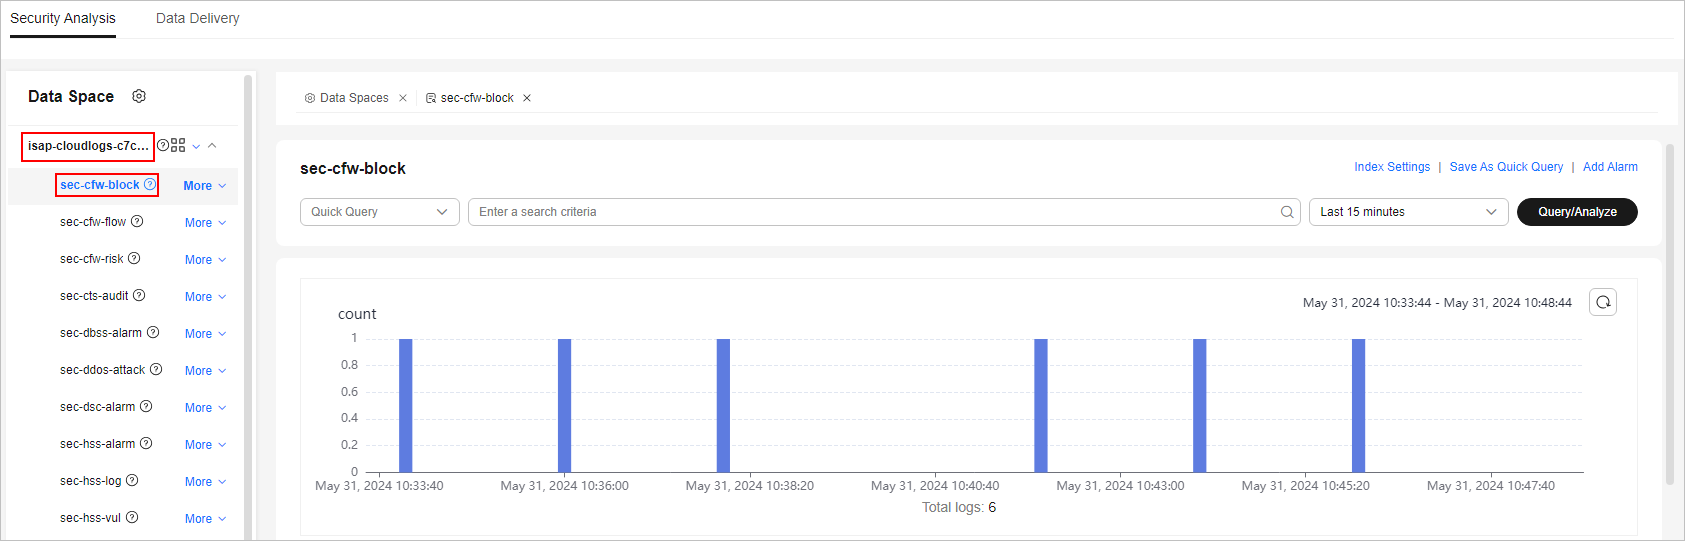
- Enter the query and analysis statement, set the time range, and click Query/Analyze.
- Click the Charts tab. In the Chart Type area on the right of the page, click
 .
. - Set parameters in the table.
Table 1 Table parameters Category
Parameter
Description
Base Settings
Title
Customize the table title.
Chart Settings
Hidden Fields
Select a target field to hide it in the table.
After the chart is configured, you can preview the configured data analysis on the left.
Related Operations
- Download logs: After the chart configuration, you can click Download in the upper right corner of the table to download the current query analysis data to the local PC.
- Hide configuration: After the chart configuration, you can click Hide Configuration on the right of the Preview to hide the parameters.
- Show configuration: After the chart configuration is hidden, you can click Show Configuration on the right of Preview to expand and set parameters.
Parent topic: Charts
Feedback
Was this page helpful?
Provide feedbackThank you very much for your feedback. We will continue working to improve the documentation.See the reply and handling status in My Cloud VOC.
The system is busy. Please try again later.
For any further questions, feel free to contact us through the chatbot.
Chatbot


