Viewing Alarms
On the Alarms tab, you can query alarms from the last 180 days. You can view the alarm details, including alarm name, type, risk severity, and generation time. By applying custom filters, such as the alarm name, risk severity, and time, you can quickly query information about specific alarms.
This makes it easier to handle alarms in a timely manner, marking the alarm processing statuses or exporting all alarms in the last 180 days in a click or two.
Constraints
- Ignoring or marking an alarm event is only supported in the standard and professional editions.
- Exporting only a certain type of alarms is not supported. You can export all alarms for the last 180 days.
- When search filters are applied to search for alarms, a maximum of 10,000 alarms can be displayed.
Viewing Alarm Details
- Log in to the management console.
- Click
 in the upper left corner of the page and choose Security & Compliance > Situation Awareness.
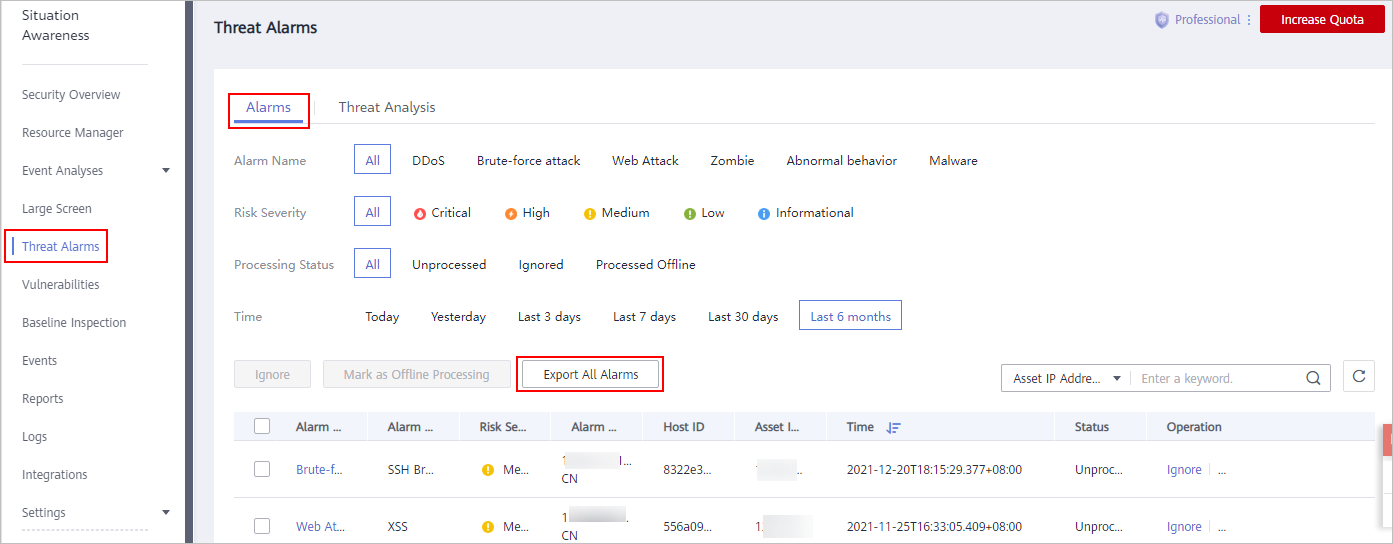
 - In the navigation pane on the left, choose Threat Alarms > Alarms.
Figure 1 Viewing alarms

- Specify Alarm Name, Risk Severity, Time, and/or Status to display only alarms that meet the filter criteria you specified.
- Alarm Name is the category that the alarm belongs to.
- Risk Severity is severity of an alarm. The options are Critical, High, Medium, Low, and Informational.
- Status is the handling status of an alarm. The options are Unhandled, Ignored, and Handled Offline.
- Time indicates a time range to display alarms generated during such range. The options are Today, Yesterday, Last 3 days, Last 7 days, Last 30 days, and Last 6 months.
- If a large number of alarms are displayed after applying your search filters, you can use the search function to quickly locate specific alarms.
You can select Asset IP Address, Alarm Source IP Address, or Host ID from the drop-down list, enter an IP address or ID in the search box, and click
 to locate information about alarms generated for a specified asset.
 - Viewing alarm details.
Click an alarm name in the alarm list. The Alarm Details window slides out from the right. You can view the basic information, detection source, attack source, and affected users of the alarm, and change the alarm processing status.
Marking Alarm Events
You can manually mark an alarm event reported by SA.
- On the Alarms tab, mark the processing status of alarms.
- Ignore: If an alarm does not cause any harm, it can be marked as Ignored.
- Mark as Offline: If the alarm has been handled offline, click Mark as Offline in the Operation column. In the displayed dialog box, fill in Processor, Processing Time, and Processing Result, and click OK.
- Marks the processing status of multiple alarms once.
Select one or more alarms in the Unhandled status and click Ignore or Mark as Offline above the alarm list to handle all selected alarms at a time.
- Marks the processing status of a single alarm.
In the Operation column of the target alarm, click Ignore or Mark as Offline to handle the alarm.
- Cancel the alarm processing status marking.
To change the processing status of an alarm, locate the target row and click Unignore or Unmark in the Operation column to restore the alarm to the Unhandled status and then re-mark the alarm processing status.
Exporting Alarm Events
On the Alarms tab, click Export All Alarms above the alarm list to export all threat alarms into an Excel file and save the file locally. After all alarms are exported, you can view them offline.

The exported Excel file contains information such as Event ID, Affected Resource, Severity, and Discovered.

Currently, only all alarm events generated for the last 180 days can be exported.
Feedback
Was this page helpful?
Provide feedbackThank you very much for your feedback. We will continue working to improve the documentation.See the reply and handling status in My Cloud VOC.
For any further questions, feel free to contact us through the chatbot.
Chatbot


