
Viewing Slow Query Logs
Slow query logs help you locate SQL statements that process a large amount of data, scan a large number of rows, or run for a long time, so that you can optimize them to improve database performance.
To use this function, you need to subscribe to Intelligent O&M first. For details, see Subscribing to Intelligent O&M.
If you did not subscribe to Intelligent O&M, you can view only the data of the last hour. The data will be automatically deleted when it expires.
Procedure
- Log in to the management console.
- Click
 in the upper left corner and select a region and project.
 - Click
 in the upper left corner of the page and choose Databases > Relational Database Service.
 - On the Instances page, click the target DB instance name to go to the Summary page.
- In the navigation pane, choose DBA Assistant > SQL Analysis and Tunning.
- Click the Slow Query Logs tab.
- In the Slow Queries over Time area, you can view the slow query log and vCPU usage trends of your DB instance.
You can view the Slow Queries over Time chart in the last 1 hour, last 3 hours, last 12 hours, or a custom time period (spanning no more than one day).
Figure 1 Slow Queries over Time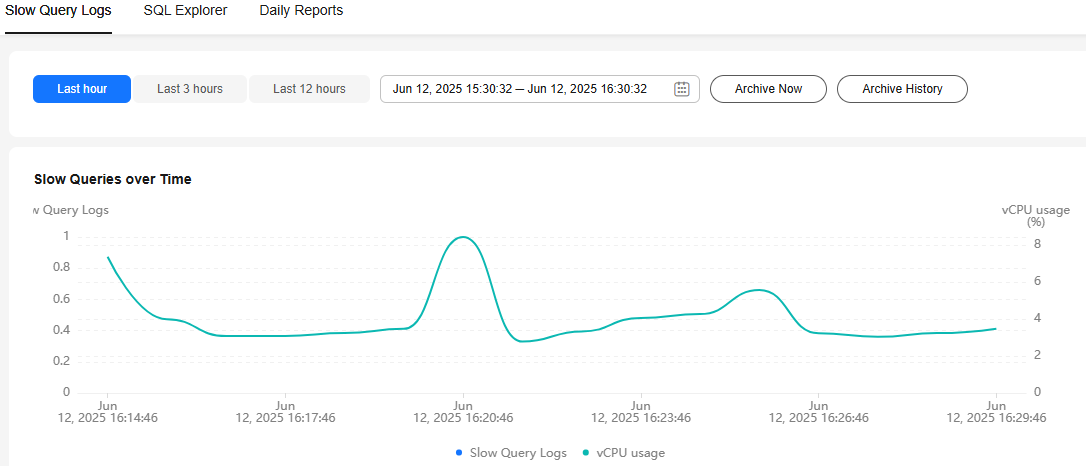
- Click Archive History. In the archived slow query logs list, view slow query log details.
The displayed details include the log start time, end time, and log file size.
Figure 2 Archived Slow Query Logs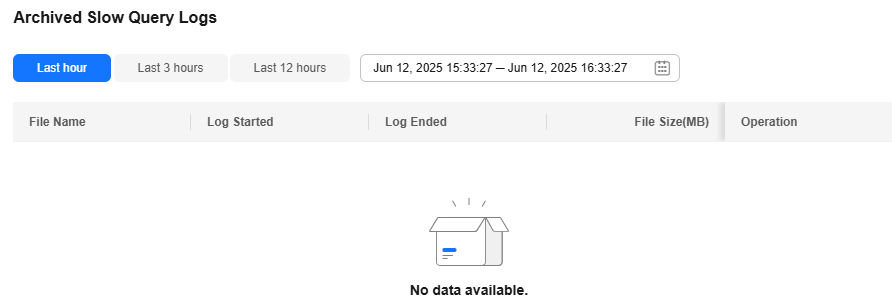

Slow query logs are automatically archived every 3 minutes. To view the latest slow query logs, click Archive Now.
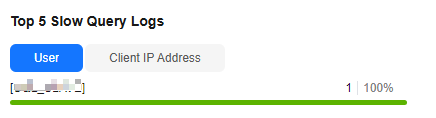
- In Top 5 Slow Query Logs area, view the top 5 slow SQL statements sorted by user or client IP address.
Figure 3 Top 5 Slow Query Logs
- In the details list, view details about slow query logs.
- You can filter slow query logs by SQL statement, database, client IP address, user, execution duration, and scanned rows.
- To export the slow query log list, click Export.
- To view log export history, click View Export List.
Feedback
Was this page helpful?
Provide feedbackThank you very much for your feedback. We will continue working to improve the documentation.See the reply and handling status in My Cloud VOC.
For any further questions, feel free to contact us through the chatbot.
Chatbot


