Managing Monitoring Metric Reports
Scenario
On FusionInsight Manager, you can customize monitoring items to display on the homepage and export monitoring data.

The interval on the horizontal axis of the chart varies depending on the time period you specify. Data monitoring rules are as follows:
- If the disk usage of the partition where GaussDB is deployed exceeds 80%, real-time monitoring data and monitoring data whose interval is 5 minutes will be deleted.
- Storage resources (HDFS) in Tenant Resources (0 to 300 hours): The interval is 1 hour. The cluster must have been installed for at least 1 hour, and monitoring data of a maximum of 3 months is saved.
- 0 to 25 hours: The interval is 5 minutes. The cluster must have been installed for at least 10 minutes, and monitoring data of a maximum of 15 days is saved.
- 25 to 150 hours: The interval is 30 minutes. The cluster must have been installed for at least 30 minutes, and monitoring data of a maximum of 3 months is saved.
- 150 to 300 hours: The interval is 1 hour. The cluster must have been installed for at least 1 hour, and monitoring data of a maximum of 3 months is saved.
- 300 hours to 300 days: The interval is 1 day. The cluster must have been installed for at least 1 day, and monitoring data of a maximum of 6 months is saved.
- Over 300 days: The interval is 7 days. The cluster must have been installed for more than 7 days, and monitoring data of a maximum of 1 year is saved.
Customizing a Monitoring Metric Report
- Log in to FusionInsight Manager.
- Choose Homepage.
- In the upper right corner of the chart area, click
 and choose Customize from the displayed menu.

Monitoring data of the past 1 hour is displayed at an interval of 5 minutes. After you enter the Real-time Monitoring page, you can view that real-time monitoring data is displayed on the right of the monitoring chart at an interval of 5 minutes.
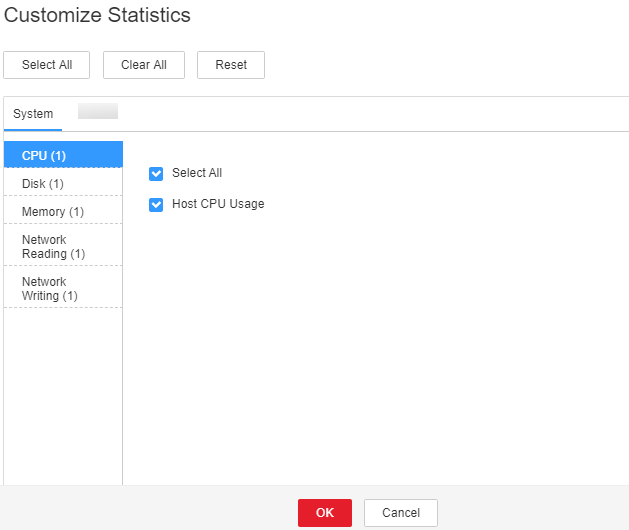
- In the left pane of the Customize Statistics dialog box, select a resource to monitor.
- Select one or multiple monitoring metrics in the right pane.
Figure 1 Customizing a monitoring metric report

- Click OK.
Exporting All Monitoring Data
- Log in to FusionInsight Manager.
- Choose Homepage.
- In the upper right corner of the chart area, select a time range to obtain monitoring data, for example, 1w.
Real-time data is displayed by default, which cannot be exported. You can click
 to customize a time range.Figure 2 Customizing a time range
- In the upper right corner of the chart area, click
 and choose Export from the displayed menu.
Exporting Monitoring Data of a Specified Monitoring Item
- Log in to FusionInsight Manager.
- Choose Homepage.
- Click
 in the upper right corner of any monitoring report pane in the chart area of the target cluster.
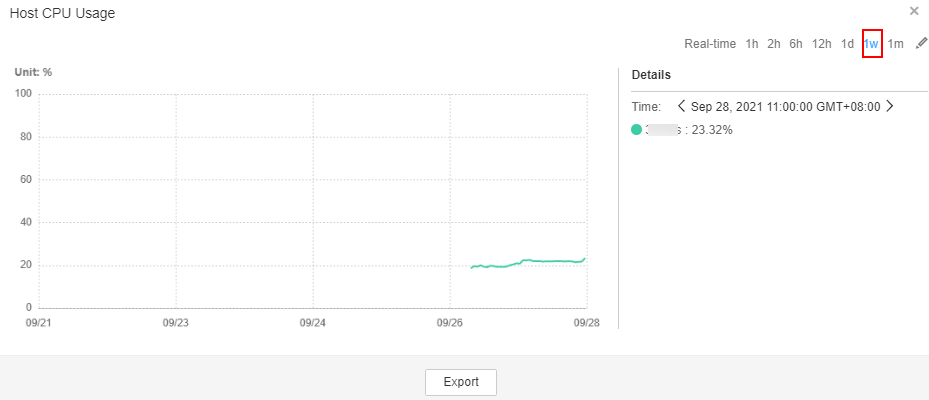
 - Select a time range to obtain monitoring data, for example, 1w.
Real-time data is displayed by default, which cannot be exported. You can click
 to customize a time range.Figure 3 Customizing a time range for a specified monitoring item
- Click Export.
Feedback
Was this page helpful?
Provide feedbackThank you very much for your feedback. We will continue working to improve the documentation.See the reply and handling status in My Cloud VOC.
For any further questions, feel free to contact us through the chatbot.
Chatbot


