ALM-43008 The Direct Memory Usage of the JobHistory2x Process Exceeds the Threshold
Description
The system checks the JobHistory2x Process status every 30 seconds. The alarm is generated when the direct memory usage of a JobHistory2x Process exceeds the threshold (95% of the maximum memory).

In MRS 3.3.0-LTS and later versions, the Spark2x component is renamed Spark, and the role names in the component are also changed. For example, JobHistory2x is changed to JobHistory. Refer to the descriptions and operations related to the component name and role names in the document based on your MRS version.
Attribute
|
Alarm ID |
Alarm Severity |
Auto Clear |
|---|---|---|
|
43008 |
Major |
Yes |
Parameters
|
Name |
Meaning |
|---|---|
|
Source |
Specifies the cluster for which the alarm is generated. |
|
ServiceName |
Specifies the service name for which the alarm is generated. |
|
RoleName |
Specifies the role name for which the alarm is generated. |
|
HostName |
Specifies the object (host ID) for which the alarm is generated. |
|
Trigger Condition |
Specifies the threshold triggering the alarm. If the current indicator value exceeds this threshold, the alarm is generated. |
Impact on the System
If the direct memory usage of the JobHistory2x process is too high, the performance deteriorates, and the process even becomes unavailable due to memory overflow. When it is unavailable, execution records of Spark tasks cannot be queried.
Possible Causes
The direct memory of the JobHistory2x Process is overused or the direct memory is inappropriately allocated.
Procedure
Check direct memory usage.
- On the FusionInsight Manager portal, choose O&M > Alarm > Alarms and select the alarm whose ID is 43008. Check the RoleName in Location and confirm the IP address of HostName.
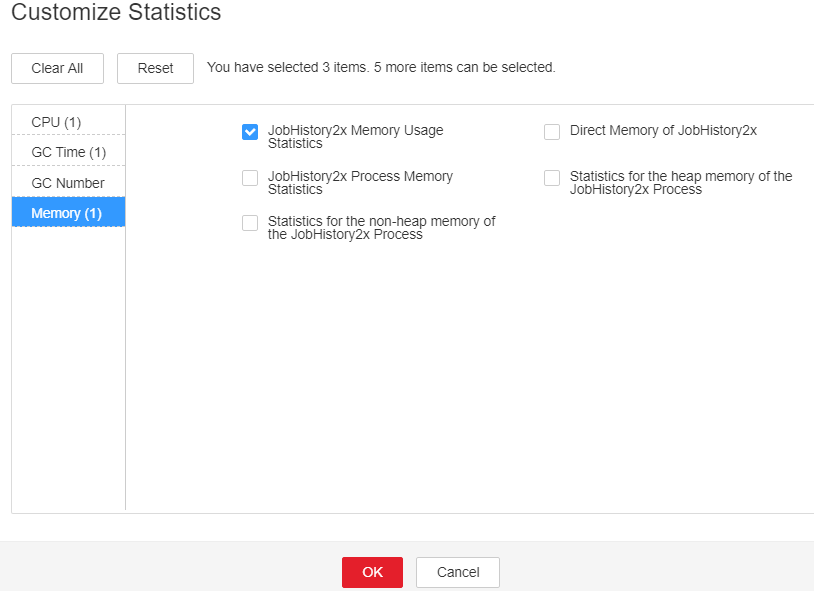
- On the FusionInsight Manager portal, choose Cluster > Services > Spark2x > Instance and click the JobHistory2x for which the alarm is generated to go to the Dashboard page. Click the drop-down menu in the Chart area and choose Customize > Memory > JobHistory2x Memory Usage Statistics from the drop-down list box in the upper right corner and click OK. Check whether the used direct memory of the JobHistory2x Process reaches the threshold (default value is 95%) of the maximum direct memory specified for JobHistory2x.
Figure 1 JobHistory2x Memory Usage Statistics

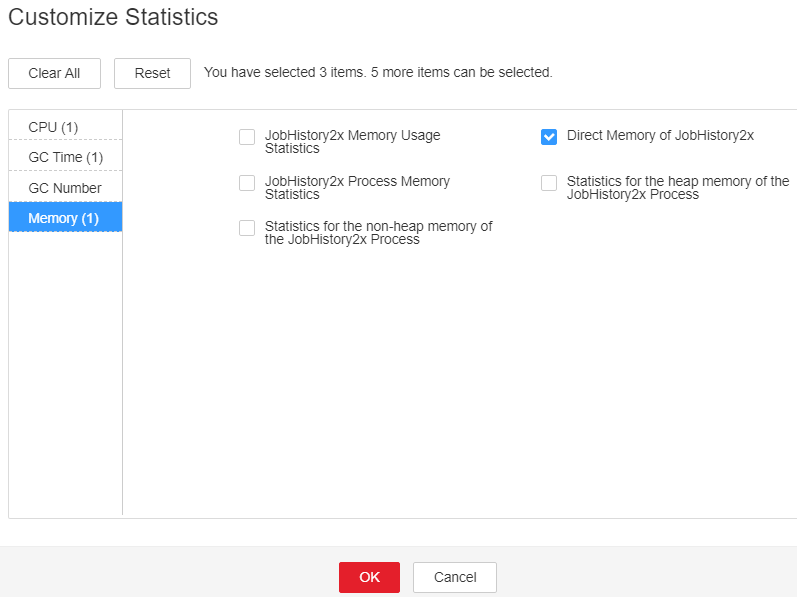
- On the FusionInsight Manager home page, choose Cluster > Services > Spark2x > Instance. Click JobHistory2x by which the alarm is reported to go to the Dashboard page, click the drop-down list in the upper right corner of the chart area, choose Customize > Memory > Direct Memory of JobHistory2x, and click OK. Based on the alarm generation time, check the values of the used direct memory of the JobHistory2x process in the corresponding period and obtain the maximum value.
Figure 2 Direct Memory of JobHistory2x

- On the FusionInsight Manager portal, choose Cluster> Services > Spark2x > Configurations, and click All Configurations. Choose JobHistory2x > Default. The default value of -XX:MaxDirectMemorySize in SPARK_DAEMON_JAVA_OPTS is 512 MB. You can change the value according to the following rules: Ratio of the maximum direct memory usage of the JobHistory2x to the Threshold of the JobHistory2x Direct Memory Usage Statistics (JobHistory2x) in the alarm period. If this alarm is generated occasionally after the parameter value is adjusted, increase the value by 0.5 times. If the alarm is frequently reported after the parameter value is adjusted, increase the value by 1 time. It is recommended that the value be less than or equal to the value of SPARK_DAEMON_MEMORY.

On the FusionInsight Manager home page, choose O&M > Alarm > Thresholds > Spark2x > Memory > JobHistory2x Direct Memory Usage Statistics (JobHistory2x) to view Threshold.
- Restart all JobHistory2x instances.

When the instance is rebooted, it cannot be used and any tasks running on the current instance node will fail.
- After 10 minutes, check whether the alarm is cleared.
- If yes, no further action is required.
- If no, go to Step 7.
Collect fault information.
- On the FusionInsight Manager portal, choose O&M > Log > Download.
- Select Spark2x in the required cluster from the Service.
- Click
 in the upper right corner, and set Start Date and End Date for log collection to 10 minutes ahead of and after the alarm generation time, respectively. Then, click Download.
 - Send the collected fault logs to O&M personnel for help.
Alarm Clearing
After the fault is rectified, the system automatically clears this alarm.
Related Information
None
Feedback
Was this page helpful?
Provide feedbackThank you very much for your feedback. We will continue working to improve the documentation.See the reply and handling status in My Cloud VOC.
For any further questions, feel free to contact us through the chatbot.
Chatbot


