

ALM-19013 Duration of Regions in transaction State Exceeds the Threshold
Description
The system checks the number of regions in transaction state on HBase every 300 seconds. This alarm is generated when the system detects that the duration of regions in transaction state exceeds the threshold for two consecutive times. This alarm is cleared when all timeout regions are restored.
Attribute
| Alarm ID | Alarm Severity | Automatically Cleared |
|---|---|---|
| 19013 | Major | Yes |
Parameters
| Name | Meaning |
|---|---|
| Source | Specifies the cluster for which the alarm is generated. |
| ServiceName | Specifies the service for which the alarm is generated. |
| RoleName | Specifies the role for which the alarm is generated. |
| HostName | Specifies the host for which the alarm is generated. |
Impact on the System
Some data in the table gets lost or becomes unavailable.
Possible Causes
- Compaction is permanently blocked.
- The HDFS files are abnormal.
Procedure
Identify the alarm cause.
- On Manager, choose O&M > Alarm > Alarms, select this alarm whose ID is 19013, and view the HostName and RoleName in Location.
For details about how to log in to FusionInsight Manager, see Accessing MRS Manager.
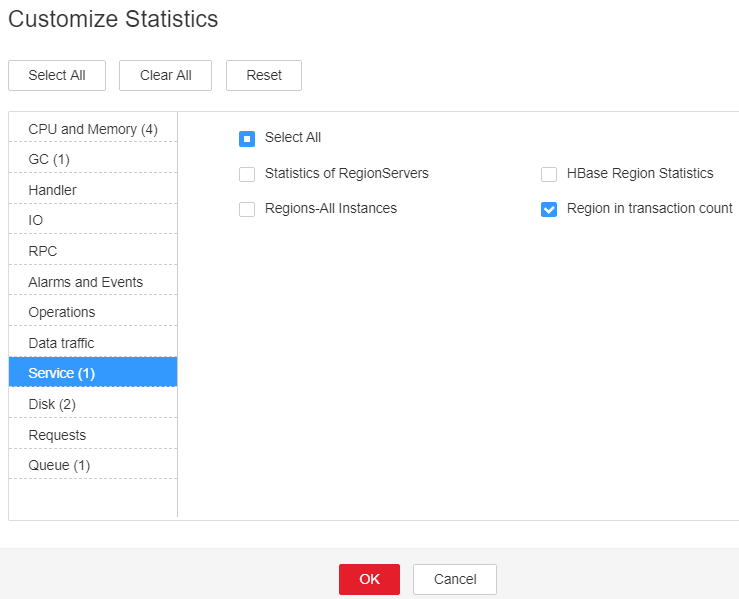
- Choose Cluster > Services > HBase. Click the drop-down list in the upper right corner of the Chart area, choose Customize > Service > Region in transaction count and click OK. Check whether the monitoring item Region in transaction count over threshold has detected values for three consecutive cycles (the default threshold is 60 seconds). Figure 1 Region in transaction count
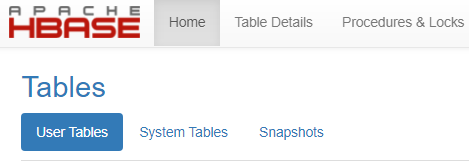
- In the basic information area, click the HMaster(xxx, Active) hyperlink next to HMaster Web UI to go to the HBase web UI. In the Tables area on the Home page, check whether only the regions of a specific table are experiencing RIT timeouts. Figure 2 Tables
- Log in to the node where the HBase client is installed as user root and run the following commands:
Go to the client installation directory.
cd Client installation directory
Configure environment variables.
source bigdata_env
If Kerberos authentication is enabled for the cluster (in security mode), run the following command to authenticate the user:
kinit hbase
- Run the following command and check whether the error message "No table descriptor file under hdfs://hacluster/hbase/data/default/table" is displayed.
hbase hbck
- On the HBase web UI, choose Procedure & Locks. In the Procedures area, check whether there is region in the Waiting state and record its Procedure ID in the Id column.
- Run the following command to release the procedure lock:
hbase hbck -j Client installation directory/HBase/hbase/tools/hbase-hbck2-*.jar bypass -o pidpid is the procedure ID of the region in the Waiting state recorded in Step 6.
- After the procedure lock is released, check whether the State of the region is RUNNABLE(Bypass) in the Procedures area mentioned in Step 6.
- On Manager, choose Cluster > Services > HBase. In the upper right corner of the Dashboard page, choose More > Perform HMaster Switchover, enter the current user password, and click OK to perform an HMaster active/standby switchover.
- After the HMaster active/standby switchover is successful, wait for several minutes and run the following command to set the region status to CLOSED:
hbase hbck -j Client installation directory/HBase/hbase/tools/hbase-hbck2-*.jar setRegionState RegionName CLOSED - Run the following command to manually bring the region online again:
hbase hbck -j Client installation directory/HBase/hbase/tools/hbase-hbck2-*.jar assigns -o RegionName - Run the following command on the client and check whether the error message "No table descriptor file under hdfs://hacluster/hbase/data/default/table" is displayed:
hbase hbck
- If yes, go to Step 13.
- If no, no further action is required.
Collect fault information.
- On Manager of the cluster, choose O&M. In the navigation pane on the left, choose Log > Download.
- In the Service area, select faulty HBase services in the required cluster.
- Click
 in the upper right corner, and set Start Date and End Date for log collection to 10 minutes ahead of and after the alarm generation time, respectively. Then, click Download.
 - Contact the O&M personnel and send the collected logs.
Alarm Clearing
After the fault is rectified, the system automatically clears this alarm.
Related Information
None
What is your overall rating for this page?
Thank you very much for your feedback. We will continue working to improve the documentation.See the reply and handling status in My Cloud VOC.
For any further questions, feel free to contact us through the chatbot.
Chatbot


