ALM-18014 NodeManager Direct Memory Usage Exceeds the Threshold
Description
The system checks the direct memory usage of the Yarn service every 30 seconds. This alarm is generated when the direct memory usage of a NodeManager instance exceeds the threshold (90% of the maximum memory).
The alarm is cleared when the direct memory usage is less than the threshold.
Attribute
|
Alarm ID |
Alarm Severity |
Automatically Cleared |
|---|---|---|
|
18014 |
Major |
Yes |
Parameters
|
Name |
Meaning |
|---|---|
|
Source |
Specifies the cluster for which the alarm is generated. |
|
ServiceName |
Specifies the service for which the alarm is generated. |
|
RoleName |
Specifies the role for which the alarm is generated. |
|
HostName |
Specifies the host for which the alarm is generated. |
|
Trigger Condition |
Specifies the threshold triggering the alarm. If the current indicator value exceeds this threshold, the alarm is generated. |
Impact on the System
If the available direct memory of the Yarn service is insufficient, a memory overflow occurs and the service breaks down.
Possible Causes
The direct memory of the NodeManager instance is overused or the direct memory is inappropriately allocated.
Procedure
Check the direct memory usage.
- On FusionInsight Manager, choose O&M > Alarm > Alarms > ALM-18014 NodeManager Direct Memory Usage Exceeds the Threshold > Location. View the IP address of the alarmed instance.
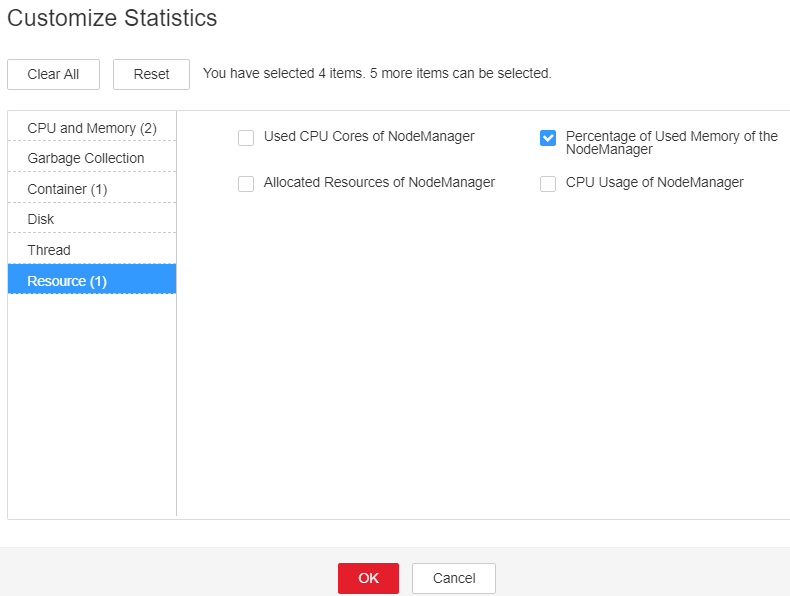
- On the Home page of FusionInsight Manager, choose Cluster > Name of the desired cluster > Services > Yarn. On the page that is displayed, click the Instance tab. In the instance list, select NodeManager (IP address of the instance for which this alarm is generated). Click the drop-down list in the upper right corner of the chart, choose Customize > Resource, and select Percentage of Used Memory of the NodeManager. Check the direct memory usage.
Figure 1 Percentage of Used Memory of the NodeManager

- Check whether the used direct memory of NodeManager reaches 90% of the maximum direct memory specified for NodeManager by default.
- On the FusionInsight Manager portal, choose Cluster > Name of the desired cluster > Services > Yarn > Configurations > All Configurations > NodeManager > System. Check whether -XX:MaxDirectMemorySize exists in the GC_OPTS parameter.
- In the GC_OPTS parameter, delete "-XX:MaxDirectMemorySize".
- Save the configuration and restart the NodeManager instance.

During NodeManager restart, containers submitted to this node may be retried to other nodes.
- Check whether the ALM-18018 NodeManager Heap Memory Usage Exceeds the Threshold exists.
- If yes, handle the alarm by referring to ALM-18018 NodeManager Heap Memory Usage Exceeds the Threshold.
- If no, go to Step 8.
- Check whether the alarm is cleared.
- If yes, no further action is required.
- If no, go to Step 9.
Collect fault information.
- On the FusionInsight Manager portal, choose O&M > Log > Download.
- Select NodeManager in the required cluster from the Service.
- Click
 in the upper right corner, and set Start Date and End Date for log collection to 10 minutes ahead of and after the alarm generation time, respectively. Then, click Download.
 - Contact the O&M personnel and send the collected logs.
Alarm Clearing
After the fault is rectified, the system automatically clears this alarm.
Related Information
None
Feedback
Was this page helpful?
Provide feedbackThank you very much for your feedback. We will continue working to improve the documentation.See the reply and handling status in My Cloud VOC.
For any further questions, feel free to contact us through the chatbot.
Chatbot


