ALM-18010 ResourceManager GC Time Exceeds the Threshold
Description
The system checks the garbage collection (GC) duration of the ResourceManager process every 60 seconds. This alarm is generated when the GC duration exceeds the threshold (12 seconds by default).
This alarm is cleared when the GC duration is less than the threshold.
Attribute
|
Alarm ID |
Alarm Severity |
Automatically Cleared |
|---|---|---|
|
18010 |
Major |
Yes |
Parameters
|
Name |
Meaning |
|---|---|
|
Source |
Specifies the cluster for which the alarm is generated. |
|
ServiceName |
Specifies the service for which the alarm is generated. |
|
RoleName |
Specifies the role for which the alarm is generated. |
|
HostName |
Specifies the host for which the alarm is generated. |
|
Trigger Condition |
Specifies the threshold triggering the alarm. If the current indicator value exceeds this threshold, the alarm is generated. |
Impact on the System
A long GC duration of the ResourceManager process may interrupt the services.
Possible Causes
The heap memory of the ResourceManager instance is overused or the heap memory is inappropriately allocated. As a result, GCs occur frequently.
Procedure
Check the GC duration.
- On FusionInsight Manager, choose O&M > Alarm > Alarms > ALM-18010 ResourceManager GC Time Exceeds the Threshold > Location. View the IP address of the alarmed instance.
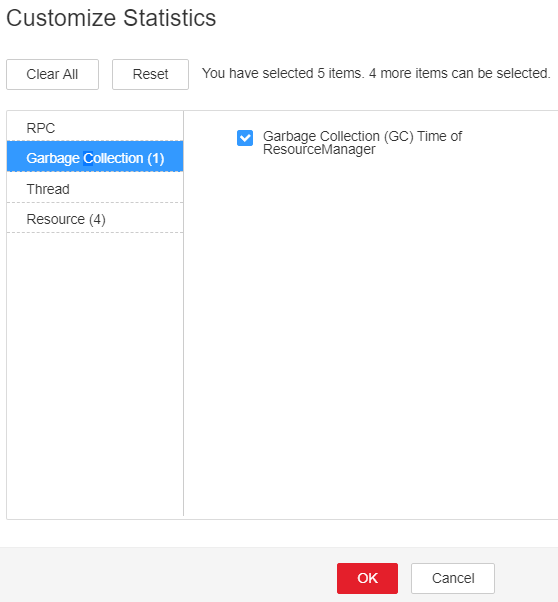
- On the Home page of FusionInsight Manager, choose Cluster > Name of the target cluster > Services > Yarn. On the page that is displayed, click the Instance tab. In the instance list, select ResourceManager (IP address of the instance for which this alarm is generated). Click the drop-down list in the upper right corner of the chart, choose Customize > Garbage Collection, and select Garbage Collection (GC) Time of ResourceManager. Check the GC duration statistics of the ResourceManager process every minute.
Figure 1 Garbage Collection (GC) Time of ResourceManager

- Check whether the GC duration of the ResourceManager process collected every minute exceeds the threshold (12 seconds by default).
- On FusionInsight Manager, choose Cluster, click the name of the desired cluster, and choose Services > Yarn > Configurations > All Configurations > ResourceManager > System. Increase the value of the GC_OPTS parameter as required.

The mapping between the number of NodeManager instances in a cluster and the memory size of ResourceManager is as follows:
- If the number of NodeManager instances in the cluster reaches 100, the recommended JVM parameters of the ResourceManager instance are as follows: -Xms4G -Xmx4G -XX:NewSize=512M -XX:MaxNewSize=1G
- If the number of NodeManager instances in the cluster reaches 200, the recommended JVM parameters of the ResourceManager instance are as follows: -Xms6G -Xmx6G -XX:NewSize=512M -XX:MaxNewSize=1G
- If the number of NodeManager instances in the cluster reaches 500, the recommended JVM parameters of the ResourceManager instance are as follows: -Xms10G -Xmx10G -XX:NewSize=1G -XX:MaxNewSize=2G
- If the number of NodeManager instances in the cluster reaches 1000, the recommended JVM parameters of the ResourceManager instance are as follows: -Xms20G -Xmx20G -XX:NewSize=1G -XX:MaxNewSize=2G
- If the number of NodeManager instances in the cluster reaches 2000, the recommended JVM parameters of the ResourceManager instance are as follows: -Xms40G -Xmx40G -XX:NewSize=2G -XX:MaxNewSize=4G
- If the number of NodeManager instances in the cluster reaches 3000, the recommended JVM parameters of the ResourceManager instance are as follows: -Xms60G -Xmx60G -XX:NewSize=2G -XX:MaxNewSize=4G
- If the number of NodeManager instances in the cluster reaches 4000, the recommended JVM parameters of the ResourceManager instance are as follows: -Xms80G -Xmx80G -XX:NewSize=2G -XX:MaxNewSize=4G
- If the number of NodeManager instances in the cluster reaches 5000, the recommended JVM parameters of the ResourceManager instance are as follows: -Xms100G -Xmx100G -XX:NewSize=3G -XX:MaxNewSize=6G
- Save the configuration and restart the ResourceManager instance.

- Restarting the active ResourceManager instance will trigger a active/standby switchover of the ResourceManager instance. During the switchover, Yarn cannot submit new jobs, but submitted jobs are not affected. The Yarn component and components that depend on Yarn generate service unavailable alarms for a short period of time.
- Restart the standby ResourceManager instance. Services are not affected.
- Check whether the alarm is cleared.
- If yes, no further action is required.
- If no, go to Step 7.
Collect fault information.
- On the FusionInsight Manager portal, choose O&M > Log > Download.
- Select ResourceManager in the required cluster from the Service.
- Click
 in the upper right corner, and set Start Date and End Date for log collection to 10 minutes ahead of and after the alarm generation time, respectively. Then, click Download.
 - Contact the O&M personnel and send the collected logs.
Alarm Clearing
After the fault is rectified, the system automatically clears this alarm.
Related Information
None
Feedback
Was this page helpful?
Provide feedbackThank you very much for your feedback. We will continue working to improve the documentation.See the reply and handling status in My Cloud VOC.
For any further questions, feel free to contact us through the chatbot.
Chatbot


